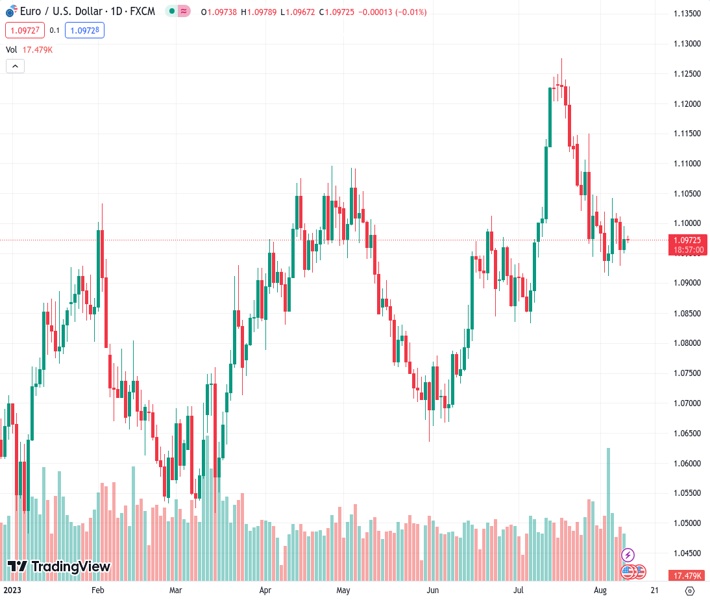
The EURUSD currency pair is staying stable around the 1.09728 level and remains within an important technical range. It has slightly increased recently. The perspective from Nehcap is that there is not much potential for further upward movement.
…
This is a premium post.
[s2If !current_user_can(access_s2member_level4)]Please register for FREE REGISTER to read full post below containing analysis. In case of any error or you think you are not able to read the full post below, please email us at support#nehcap.com [lwa][/s2If] [s2If current_user_can(access_s2member_level1)]
- EUR/USD treads water within key technical envelope, edges higher of late.
The pair currently trades last at 1.09728.
The previous day high was 1.0995 while the previous day low was 1.0952. The daily 38.2% Fib levels comes at 1.0979, expected to provide resistance. Similarly, the daily 61.8% fib level is at 1.0969, expected to provide support.
EUR/USD portrays the tug-of-war between the bulls and the bears as the quote remains tightly gripped around the 1.0980 resistance amid early Thursday. In doing so, the Euro pair justifies the market’s cautious mood ahead of the European Central Bank’s (ECB) monthly Economic Bulletin and the US States inflation data, per the Consumer Price Index (CPI) for July.
Also read: EUR/USD remains defensive above 1.0950, ECB Economic Bulletin, US inflation eyed
Technically, the Euro pair stays between a three-week-old descending resistance line and the 50-DMA support. However, the bearish MACD signals keep sellers hopeful ahead of the key data/events.
Though, the quote’s downside break of the 50-DMA support of 1.0955 won’t give a full hand to the bears as the 100-DMA level of around 1.0930 will act as the final defense of the buyers.
In a case where the EUR/USD drops below 1.0930, the odds of witnessing a slump towards the five-month-old rising support line, close to 1.0790 by the press time, can’t be ruled out.
On the flip side, a daily closing beyond the 1.0980 resistance can challenge the monthly high of 1.1042 before targeting the tops marked in April and May surrounding 1.1100.
Following that, the 1.1150 and 1.1200 round figures may test the EUR/USD bulls before directing them to the yearly high marked late in July near 1.1275.
Trend: Limited upside expected
Technical Levels: Supports and Resistances
EURUSD currently trading at 1.0972 at the time of writing. Pair opened at 1.0974 and is trading with a change of -0.02% % .
| Overview | Overview.1 | |
|---|---|---|
| 0 | Today last price | 1.0972 |
| 1 | Today Daily Change | -0.0002 |
| 2 | Today Daily Change % | -0.02% |
| 3 | Today daily open | 1.0974 |
The pair is trading below its 20 Daily moving average @ 1.1069, above its 50 Daily moving average @ 1.0953 , above its 100 Daily moving average @ 1.0926 and above its 200 Daily moving average @ 1.0761
| Trends | Trends.1 | |
|---|---|---|
| 0 | Daily SMA20 | 1.1069 |
| 1 | Daily SMA50 | 1.0953 |
| 2 | Daily SMA100 | 1.0926 |
| 3 | Daily SMA200 | 1.0761 |
The previous day high was 1.0995 while the previous day low was 1.0952. The daily 38.2% Fib levels comes at 1.0979, expected to provide resistance. Similarly, the daily 61.8% fib level is at 1.0969, expected to provide support.
Note the levels of interest below:
- Pivot support is noted at 1.0952, 1.0931, 1.0909
- Pivot resistance is noted at 1.0996, 1.1017, 1.1039
| Levels | Levels.1 |
|---|---|
| Previous Daily High | 1.0995 |
| Previous Daily Low | 1.0952 |
| Previous Weekly High | 1.1046 |
| Previous Weekly Low | 1.0912 |
| Previous Monthly High | 1.1276 |
| Previous Monthly Low | 1.0834 |
| Daily Fibonacci 38.2% | 1.0979 |
| Daily Fibonacci 61.8% | 1.0969 |
| Daily Pivot Point S1 | 1.0952 |
| Daily Pivot Point S2 | 1.0931 |
| Daily Pivot Point S3 | 1.0909 |
| Daily Pivot Point R1 | 1.0996 |
| Daily Pivot Point R2 | 1.1017 |
| Daily Pivot Point R3 | 1.1039 |
[/s2If]
Download Nehcap EAWe have two EAs that are operational on our LIVE accounts.
- EA-FIX: Check out the details here. Download EA-FIX . EA-FIX is a non-grid HFT scalper.
- EA-GROWTH: High quality low dd EA using trend grids. Download EA_GROWTHJoin Our Telegram Group
")


