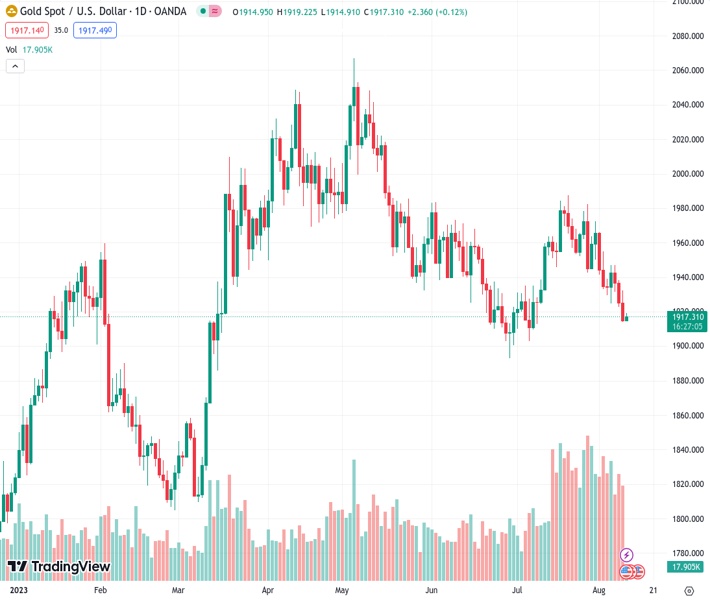
Gold price, currently at 1,917.71 in the XAUUSD market, halts its downward movement and bounces back to $1,918, experiencing a 0.22% increase throughout the day.
…
This is a premium post.
[s2If !current_user_can(access_s2member_level4)]Please register for FREE REGISTER to read full post below containing analysis. In case of any error or you think you are not able to read the full post below, please email us at support#nehcap.com [lwa][/s2If] [s2If current_user_can(access_s2member_level1)]
- Gold price stalls its decline and rebounds to $1,918, gaining 0.22% for the day.
The pair currently trades last at 1917.71.
The previous day high was 1932.43 while the previous day low was 1914.11. The daily 38.2% Fib levels comes at 1921.11, expected to provide resistance. Similarly, the daily 61.8% fib level is at 1925.43, expected to provide resistance.
The gold price recovers its recent losses and snaps a three-day losing streak during the Asian session on Thursday. XAU/USD currently trades around $1,918, up 0.22% on the day. Gold traders will keep an eye on the US Consumer Price Index (CPI) due later in the American session. The inflation figure is expected to rise from 3% to 3.3%, and the core inflation figure is expected to stay at 4.8%.
The US Dollar Index, a measure of the value of USD against six other major currencies, trades sideways above 102.40. Meanwhile, US 10-year Treasury bond yield stands at 4.02%, which acts as a headwind for the gold price.
The recent commentary from Federal Reserve (Fed) speakers indicated that the Fed’s stance has shifted from additional rate hikes to holding rates steady. The Philadelphia Fed president, Patrick Harker, stated that the central bank can leave interest rates where they are. Meanwhile, Atlanta Fed president Raphael Bostic states that no further rate hikes are necessary. Market players anticipated that the Fed would be less hawkish in the September meeting. The prospects of the end of the tightening policy by the Fed might cap the upside in the USD and could act as a tailwind for the XAU/USD.
That said, the concern about the economic slowdown in China exerts pressure on the gold price as China is the major gold consumer in the world. The Chinese inflation data on Wednesday showed the Consumer Price Index (CPI) YoY fell 0.3% in July from 0% prior, and the market consensus anticipated a -0.4% decline. Meanwhile, the Producer Price Index (PPI) declined 4.4% YoY, compared to the 4.1% drop expected and a 5.4% decline prior.
Looking ahead, the US Consumer Price Index (CPI) report will have a significant impact on the Federal Reserve’s (Fed) future rate hike path and help investors determine the direction of XAU/USD. Also, the US Producer Price Index for July will be released on Friday.
Technical Levels: Supports and Resistances
XAUUSD currently trading at 1918.35 at the time of writing. Pair opened at 1914.2 and is trading with a change of 0.22 % .
| Overview | Overview.1 | |
|---|---|---|
| 0 | Today last price | 1918.35 |
| 1 | Today Daily Change | 4.15 |
| 2 | Today Daily Change % | 0.22 |
| 3 | Today daily open | 1914.20 |
The pair is trading below its 20 Daily moving average @ 1952.6, below its 50 Daily moving average @ 1943.38 , below its 100 Daily moving average @ 1967.77 and above its 200 Daily moving average @ 1899.15
| Trends | Trends.1 | |
|---|---|---|
| 0 | Daily SMA20 | 1952.60 |
| 1 | Daily SMA50 | 1943.38 |
| 2 | Daily SMA100 | 1967.77 |
| 3 | Daily SMA200 | 1899.15 |
The previous day high was 1932.43 while the previous day low was 1914.11. The daily 38.2% Fib levels comes at 1921.11, expected to provide resistance. Similarly, the daily 61.8% fib level is at 1925.43, expected to provide resistance.
Note the levels of interest below:
- Pivot support is noted at 1908.06, 1901.93, 1889.74
- Pivot resistance is noted at 1926.38, 1938.57, 1944.7
| Levels | Levels.1 |
|---|---|
| Previous Daily High | 1932.43 |
| Previous Daily Low | 1914.11 |
| Previous Weekly High | 1972.45 |
| Previous Weekly Low | 1925.72 |
| Previous Monthly High | 1987.54 |
| Previous Monthly Low | 1902.77 |
| Daily Fibonacci 38.2% | 1921.11 |
| Daily Fibonacci 61.8% | 1925.43 |
| Daily Pivot Point S1 | 1908.06 |
| Daily Pivot Point S2 | 1901.93 |
| Daily Pivot Point S3 | 1889.74 |
| Daily Pivot Point R1 | 1926.38 |
| Daily Pivot Point R2 | 1938.57 |
| Daily Pivot Point R3 | 1944.70 |
[/s2If]
Download Nehcap EAWe have two EAs that are operational on our LIVE accounts.
- EA-FIX: Check out the details here. Download EA-FIX . EA-FIX is a non-grid HFT scalper.
- EA-GROWTH: High quality low dd EA using trend grids. Download EA_GROWTHJoin Our Telegram Group
")


