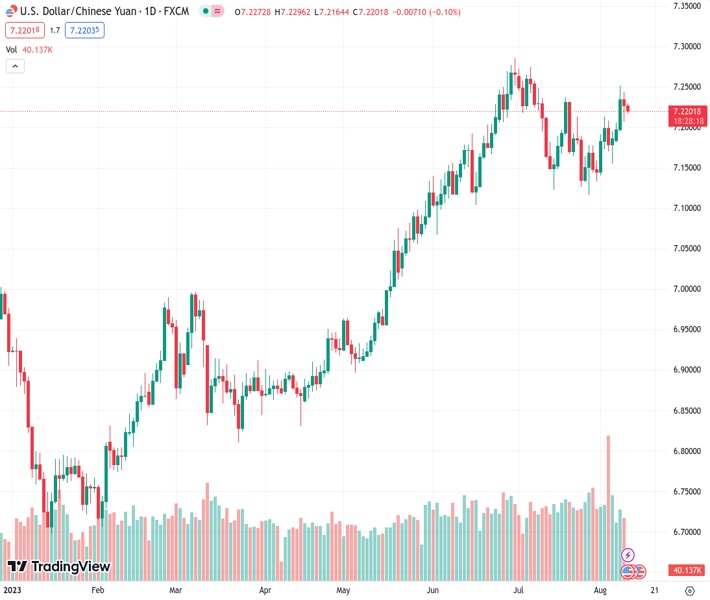
Despite China facing impending economic hardships, the USDCNH has experienced a decline for the second day in a row.
…
This is a premium post.
[s2If !current_user_can(access_s2member_level4)]Please register for FREE REGISTER to read full post below containing analysis. In case of any error or you think you are not able to read the full post below, please email us at support#nehcap.com [lwa][/s2If] [s2If current_user_can(access_s2member_level1)]
- USD/CNH drops for the second consecutive day despite looming economic hardships for China.
The pair currently trades last at 7.22024.
The previous day high was 7.2442 while the previous day low was 7.207. The daily 38.2% Fib levels comes at 7.2212, expected to provide resistance. Similarly, the daily 61.8% fib level is at 7.23, expected to provide resistance.
USD/CNH remains on the back foot for the second consecutive day, mildly offered near 7.2220 amid early Thursday morning. In doing so, the offshore Chinese Yuan (CNH) justifies the People’s Bank of China’s (PBoC) sustained efforts to defend the domestic currency while paying little heed to the latest blow from the inflation data and the US policies.
China Securities Journal (CSJ) cites multiple Chinese analysts while praising the PBoC’s sturdy efforts to keep the Yuan afloat despite the US Dollar’s latest strength. That said, the Chinese central bank has been actively participating in the open markets and keeps the USD/CNY Fix in a lower range despite the market’s expectations of witnessing a strong outcome.
That said, the PBoC set the USD/CNY fix to around 7.1576 on Thursday while posting a heavy difference between the PBoC fix and the market forecasts.
On the other hand, US Dollar Index (DXY) remains sidelined near 102.50 after snapping a two-day uptrend the previous day. In doing so, the greenback’s gauge versus the six major currencies justifies the market’s cautious mood ahead of the US inflation data, as well as a light calendar.
On Wednesday, improvement in China’s Producer Price Index (PPI) for July superseded negative readings of the Consumer Price Index (CPI) for the said month, which in turn allowed the CNH to push back the bears. That said, CPI declines to -0.3% YoY versus -0.4% YoY expected and 0.0% prior whereas the PPI improves to -4.4% YoY compared to -4.1% YoY market forecasts and -5.4% previous readings.
However, China’s Commerce Ministry showed grave concerns and marked the rights to take measures in retaliation early Thursday in Asia, per Reuters. The news also quotes China Commerce Ministry as saying, “Hopes that the US will respect laws of market economy and the principle of fair competition.”
Earlier in the day, US President Joe Biden signed the much-awaited bill that allows the US Treasury Department to prohibit or restrict certain US investments in Chinese entities, per Reuters.
Furthermore, the looming economic fears from China, Europe and the UK join the global rating agencies’ crackdown on banks to weigh on the sentiment and the AUD/USD price. On the same line are fears of deflation in China and the market’s doubts about future moves of the major central banks.
Against this backdrop, Wall Street closed in the red and the US Treasury bond yields were down while the S&P500 Futures printed mild gains by the press time.
Looking ahead, US CPI and Core CPI for July will be crucial to watch amid looming dovish Fed concerns, which if confirmed can extend the AUD/USD pair’s downside towards the key 0.6480 support.
Although the failure to cross a one-month-old horizontal hurdle surrounding 7.2370-80 favors the USD/CNH bears, a fortnight-long support line, close to 7.2090 by the press time, restricts the downside of the Yuan pair.
Technical Levels: Supports and Resistances
USDCNH currently trading at 7.22 at the time of writing. Pair opened at 7.227 and is trading with a change of -0.10% % .
| Overview | Overview.1 | |
|---|---|---|
| 0 | Today last price | 7.22 |
| 1 | Today Daily Change | -0.0070 |
| 2 | Today Daily Change % | -0.10% |
| 3 | Today daily open | 7.227 |
The pair remains strongly bullish on the daily timeframe. It trades above its 20 SMA @ 7.1822, 50 SMA 7.1859, 100 SMA @ 7.0634 and 200 SMA @ 7.0008.
| Trends | Trends.1 | |
|---|---|---|
| 0 | Daily SMA20 | 7.1822 |
| 1 | Daily SMA50 | 7.1859 |
| 2 | Daily SMA100 | 7.0634 |
| 3 | Daily SMA200 | 7.0008 |
The previous day high was 7.2442 while the previous day low was 7.207. The daily 38.2% Fib levels comes at 7.2212, expected to provide resistance. Similarly, the daily 61.8% fib level is at 7.23, expected to provide resistance.
Note the levels of interest below:
- Pivot support is noted at 7.2079, 7.1888, 7.1706
- Pivot resistance is noted at 7.2452, 7.2634, 7.2825
| Levels | Levels.1 |
|---|---|
| Previous Daily High | 7.2442 |
| Previous Daily Low | 7.2070 |
| Previous Weekly High | 7.2130 |
| Previous Weekly Low | 7.1330 |
| Previous Monthly High | 7.2744 |
| Previous Monthly Low | 7.1160 |
| Daily Fibonacci 38.2% | 7.2212 |
| Daily Fibonacci 61.8% | 7.2300 |
| Daily Pivot Point S1 | 7.2079 |
| Daily Pivot Point S2 | 7.1888 |
| Daily Pivot Point S3 | 7.1706 |
| Daily Pivot Point R1 | 7.2452 |
| Daily Pivot Point R2 | 7.2634 |
| Daily Pivot Point R3 | 7.2825 |
[/s2If]
Download Nehcap EAWe have two EAs that are operational on our LIVE accounts.
- EA-FIX: Check out the details here. Download EA-FIX . EA-FIX is a non-grid HFT scalper.
- EA-GROWTH: High quality low dd EA using trend grids. Download EA_GROWTHJoin Our Telegram Group
")


