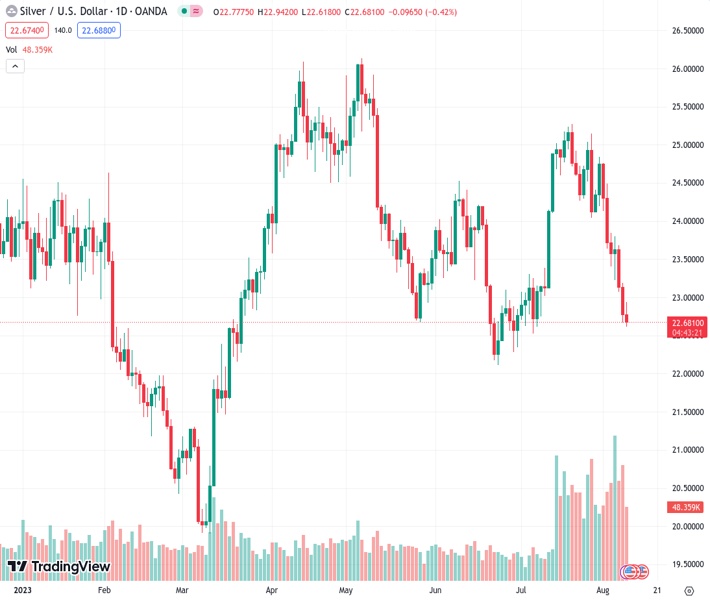
The XAGUSD pair is currently trading at around 22.687, close to the $22.70 mark, but the market sentiment is still bearish.
…
This is a premium post.
[s2If !current_user_can(access_s2member_level4)]Please register for FREE REGISTER to read full post below containing analysis. In case of any error or you think you are not able to read the full post below, please email us at support#nehcap.com [lwa][/s2If] [s2If current_user_can(access_s2member_level1)]
- XAG/USD stands near $22.70, while bears still have the upperhand.
The pair currently trades last at 22.687.
The previous day high was 23.19 while the previous day low was 22.67. The daily 38.2% Fib levels comes at 22.87, expected to provide resistance. Similarly, the daily 61.8% fib level is at 22.99, expected to provide resistance.
In Wednesday’s session, the Silver spot price XAG/USD traded with mild losses, while the USD traded weaker and corrected after two days of strength. Markets remain quiet ahead of crucial Consumer Price Index (CPI) data from the US from July, which will impact bond and metal price dynamics.
Considering this, the US bond yields showed a mixed performance on Wednesday. The 10-year bond yield trades at 4.01%, seeing 0.23 % losses on the day, while the 2-year yield stands at 4.76% with 0.12 % gains and the 5-year yielding 4.10%, seeing mild losses.
In terms of the next Federal Reserve (Fed) following monetary policy decisions, tightening expectations have risen. According to World Interest Rate Possibilities (WIRP) tool, the markets are currently pricing in a 15% chance of a 25 bps hike in the September meeting, while those odds rise to 30% in November. It will all come down to the incoming data, as Jerome Powell stated during the press conference after the last Fed decision.
It’s worth noticing that higher interest rates tend to be negatively correlated with non-yielding precious metal prices, so traders will keep a close eye on Thursday’s CPI data from the US.
The daily chart analysis indicates a bearish outlook for the XAG/USD in the short term. The Relative Strength Index (RSI) is below its midline in negative territory, with a negative slope, aligning with the negative signal from the Moving Average Convergence Divergence (MACD), displaying red bars, reinforcing the strong bearish sentiment. Moreover, the pair is below the 20,100 and 200-day Simple Moving Averages (SMAs), supporting the idea that the bears are in command in the bigger picture.
Support levels: $22.50, $22.30, $22.00.
Resistance levels: $23.25 (200-day SMA), $23.50, $23.70, $24.00.
Technical Levels: Supports and Resistances
XAGUSD currently trading at 22.68 at the time of writing. Pair opened at 22.78 and is trading with a change of -0.44 % .
| Overview | Overview.1 | |
|---|---|---|
| 0 | Today last price | 22.68 |
| 1 | Today Daily Change | -0.10 |
| 2 | Today Daily Change % | -0.44 |
| 3 | Today daily open | 22.78 |
The pair remains strongly bearish on the daily time frame. It trades below the 20 SMA @ 24.33, 50 SMA 23.72, 100 SMA @ 24.06 and 200 SMA @ 23.21.
| Trends | Trends.1 | |
|---|---|---|
| 0 | Daily SMA20 | 24.33 |
| 1 | Daily SMA50 | 23.72 |
| 2 | Daily SMA100 | 24.06 |
| 3 | Daily SMA200 | 23.21 |
The previous day high was 23.19 while the previous day low was 22.67. The daily 38.2% Fib levels comes at 22.87, expected to provide resistance. Similarly, the daily 61.8% fib level is at 22.99, expected to provide resistance.
Note the levels of interest below:
- Pivot support is noted at 22.57, 22.36, 22.04
- Pivot resistance is noted at 23.09, 23.4, 23.61
| Levels | Levels.1 |
|---|---|
| Previous Daily High | 23.19 |
| Previous Daily Low | 22.67 |
| Previous Weekly High | 24.84 |
| Previous Weekly Low | 23.23 |
| Previous Monthly High | 25.27 |
| Previous Monthly Low | 22.52 |
| Daily Fibonacci 38.2% | 22.87 |
| Daily Fibonacci 61.8% | 22.99 |
| Daily Pivot Point S1 | 22.57 |
| Daily Pivot Point S2 | 22.36 |
| Daily Pivot Point S3 | 22.04 |
| Daily Pivot Point R1 | 23.09 |
| Daily Pivot Point R2 | 23.40 |
| Daily Pivot Point R3 | 23.61 |
[/s2If]
Download Nehcap EAWe have two EAs that are operational on our LIVE accounts.
- EA-FIX: Check out the details here. Download EA-FIX . EA-FIX is a non-grid HFT scalper.
- EA-GROWTH: High quality low dd EA using trend grids. Download EA_GROWTHJoin Our Telegram Group
")


