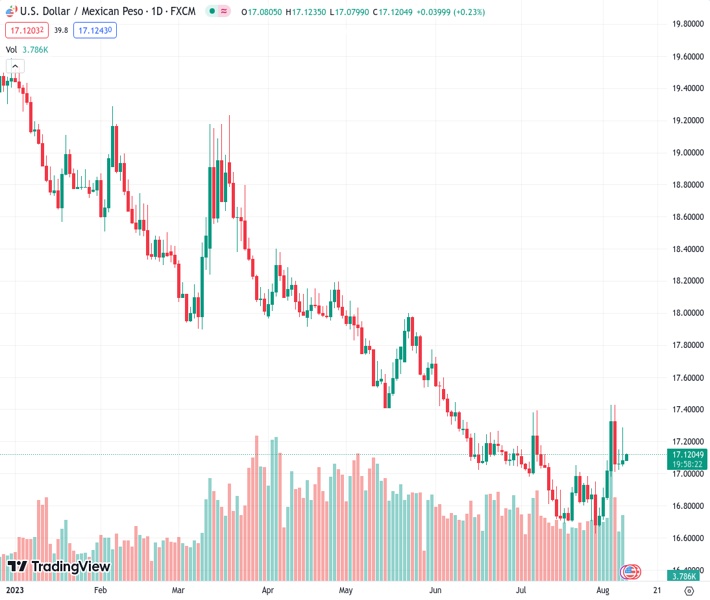
The US dollar against the Mexican peso, trading at 17.1180, protects the recent rebound made the previous day against a support line that has been rising for eight days. This comes before the release of inflation data for July in Mexico. According to @nehcap, it is anticipated that there will be further improvement in the currency’s value.
…
This is a premium post.
[s2If !current_user_can(access_s2member_level4)]Please register for FREE REGISTER to read full post below containing analysis. In case of any error or you think you are not able to read the full post below, please email us at support#nehcap.com [lwa][/s2If] [s2If current_user_can(access_s2member_level1)]
- USD/MXN defends the previous day’s rebound from eight-day-old rising support line ahead of Mexico inflation numbers for July.
The pair currently trades last at 17.1180.
The previous day high was 17.2852 while the previous day low was 17.0519. The daily 38.2% Fib levels comes at 17.1961, expected to provide resistance. Similarly, the daily 61.8% fib level is at 17.141, expected to provide resistance.
USD/MXN clings to mild gains around 17.11 as it defends late Tuesday’s corrective bounce off a one-week-long rising support line amid a sluggish start to Wednesday’s trading. In doing so, the Mexican Peso (MXN) justifies the market’s cautious mood ahead of Mexico’s headline inflation numbers for July, scheduled for release at noon per the GMT today.
Also read: USD/MXN advances amid global risk-aversion and strong US Dollar
Apart from the immediate support line, an impending bull cross on the MACD and steady RSI (14), as well as the broad US Dollar strength amid the risk-off mood, also favors the USD/MXN buyers.
However, a descending resistance line from Friday, around 17.26 by the press time, guards the immediate recovery of the Mexican Peso pair.
Following that, the monthly high of 17.42 will be crucial to break for the USD/MXN bulls to keep the reins.
On the contrary, a downside break of the aforementioned support line, near 17.05 by the press time, isn’t an open invitation to the USD/MXN bears. The reason could be linked to the existence of convergence of the 200-SMA and the previous resistance line stretched from May 31, around 16.97 by the press time.
Trend: Further recovery expected
Technical Levels: Supports and Resistances
USDMXN currently trading at 17.1148 at the time of writing. Pair opened at 17.0986 and is trading with a change of 0.09% % .
| Overview | Overview.1 | |
|---|---|---|
| 0 | Today last price | 17.1148 |
| 1 | Today Daily Change | 0.0162 |
| 2 | Today Daily Change % | 0.09% |
| 3 | Today daily open | 17.0986 |
The pair is trading above its 20 Daily moving average @ 16.8994, above its 50 Daily moving average @ 17.088 , below its 100 Daily moving average @ 17.5277 and below its 200 Daily moving average @ 18.2884
| Trends | Trends.1 | |
|---|---|---|
| 0 | Daily SMA20 | 16.8994 |
| 1 | Daily SMA50 | 17.0880 |
| 2 | Daily SMA100 | 17.5277 |
| 3 | Daily SMA200 | 18.2884 |
The previous day high was 17.2852 while the previous day low was 17.0519. The daily 38.2% Fib levels comes at 17.1961, expected to provide resistance. Similarly, the daily 61.8% fib level is at 17.141, expected to provide resistance.
Note the levels of interest below:
- Pivot support is noted at 17.0052, 16.9118, 16.7718
- Pivot resistance is noted at 17.2386, 17.3786, 17.472
| Levels | Levels.1 |
|---|---|
| Previous Daily High | 17.2852 |
| Previous Daily Low | 17.0519 |
| Previous Weekly High | 17.4274 |
| Previous Weekly Low | 16.6694 |
| Previous Monthly High | 17.3957 |
| Previous Monthly Low | 16.6258 |
| Daily Fibonacci 38.2% | 17.1961 |
| Daily Fibonacci 61.8% | 17.1410 |
| Daily Pivot Point S1 | 17.0052 |
| Daily Pivot Point S2 | 16.9118 |
| Daily Pivot Point S3 | 16.7718 |
| Daily Pivot Point R1 | 17.2386 |
| Daily Pivot Point R2 | 17.3786 |
| Daily Pivot Point R3 | 17.4720 |
[/s2If]
Download Nehcap EAWe have two EAs that are operational on our LIVE accounts.
- EA-FIX: Check out the details here. Download EA-FIX . EA-FIX is a non-grid HFT scalper.
- EA-GROWTH: High quality low dd EA using trend grids. Download EA_GROWTHJoin Our Telegram Group
")


