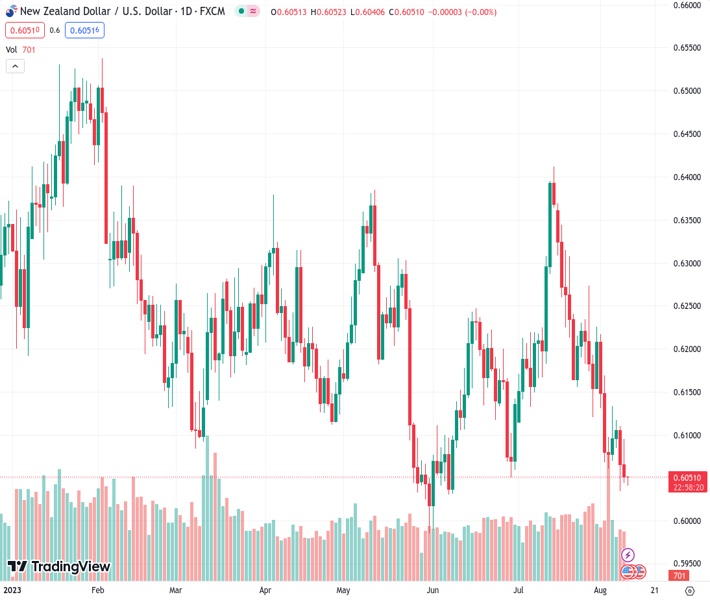
The NZDUSD currency pair has dropped by 0.24% to a rate of 0.60525, due to concerns about a slowdown in China’s economy. As a result, the currency pair is currently being traded with caution at 0.6050, as investors await the release of US inflation data.
…
This is a premium post.
[s2If !current_user_can(access_s2member_level4)]Please register for FREE REGISTER to read full post below containing analysis. In case of any error or you think you are not able to read the full post below, please email us at support#nehcap.com [lwa][/s2If] [s2If current_user_can(access_s2member_level1)]
- NZD/USD dips 0.24% following economic slowdown fears in China, trading cautiously at 0.6050 ahead of US inflation data.
The pair currently trades last at 0.60525.
The previous day high was 0.6112 while the previous day low was 0.6035. The daily 38.2% Fib levels comes at 0.6064, expected to provide resistance. Similarly, the daily 61.8% fib level is at 0.6082, expected to provide resistance.
NZD/USD extended its losses for two straight days on Wednesday, losing 0.24% after hitting a daily high of 0.6094, but deflation in China spurred fears of an economic slowdown. That, alongside the release of inflation in the United States (US), would keep the NZD/USD trading within narrow ranges. The NZD/USD changes hands at 0.6050 as the Asian session commences.
The lack of economic news turned market sentiment sour, but the greenback, as shown by the US Dollar Index (DXY) failed to gain traction ahead of an important US inflation report. The Consumer Price Index (CPI) for July is estimated to dip to 0.2% on MoM, while annually based to dip to 3% from 3.3% in June. Regarding core CPI, which strips out volatile items, is estimated to remain at 0.2%, unchanged, while Year-over-year is estimated to slow from 4.8% to 4.7%.
Aside from data in the calendar, Federal Reserve officials remain focused on data, which has shown that monetary policy is lagging, but the deflationary process started. Additional policymakers are turning neutral, while Michelle Bowman commented that further tightening is needed.
The CME FedWatch Tool shows odds for a rate hike in September at 13.5%, as money market futures do not expect more borrowing costs to increase. Nonetheless, if Fed officials begin to pile into the dovish stance, any rate cut signals would weaken the greenback; hence further NZD/USD upside is expected.
An absent docket on the New Zealand (NZ) front will keep traders focused on US Dollar dynamics. ANZ analysts expect the Reserve Bank of New Zealand (RBNZ) to hold rates at 5.50% at its next monetary policy meeting next Wednesday. “The RBNZ is expected to reiterate their “watch, worry and wait” stance.
The NZD/USD downtrend remains intact after dropping below the daily Exponential Moving Averages (EMAs). Also, successive series of lower peaks and throughs open the door to test yearly lows. It the NZD/USD dives below the current week’s low of 0.6034, the next support would emerge at the July 8 low of 0.6031. Once cleared, the next demand area would be the 0.6000 mark, below testing the year-to-date (YTD) low of 0.5985.
Technical Levels: Supports and Resistances
NZDUSD currently trading at 0.6049 at the time of writing. Pair opened at 0.6066 and is trading with a change of -0.28 % .
| Overview | Overview.1 | |
|---|---|---|
| 0 | Today last price | 0.6049 |
| 1 | Today Daily Change | -0.0017 |
| 2 | Today Daily Change % | -0.2800 |
| 3 | Today daily open | 0.6066 |
The pair remains strongly bearish on the daily time frame. It trades below the 20 SMA @ 0.6203, 50 SMA 0.6166, 100 SMA @ 0.619 and 200 SMA @ 0.623.
| Trends | Trends.1 | |
|---|---|---|
| 0 | Daily SMA20 | 0.6203 |
| 1 | Daily SMA50 | 0.6166 |
| 2 | Daily SMA100 | 0.6190 |
| 3 | Daily SMA200 | 0.6230 |
The previous day high was 0.6112 while the previous day low was 0.6035. The daily 38.2% Fib levels comes at 0.6064, expected to provide resistance. Similarly, the daily 61.8% fib level is at 0.6082, expected to provide resistance.
Note the levels of interest below:
- Pivot support is noted at 0.6029, 0.5993, 0.5952
- Pivot resistance is noted at 0.6107, 0.6148, 0.6184
| Levels | Levels.1 |
|---|---|
| Previous Daily High | 0.6112 |
| Previous Daily Low | 0.6035 |
| Previous Weekly High | 0.6226 |
| Previous Weekly Low | 0.6060 |
| Previous Monthly High | 0.6413 |
| Previous Monthly Low | 0.6120 |
| Daily Fibonacci 38.2% | 0.6064 |
| Daily Fibonacci 61.8% | 0.6082 |
| Daily Pivot Point S1 | 0.6029 |
| Daily Pivot Point S2 | 0.5993 |
| Daily Pivot Point S3 | 0.5952 |
| Daily Pivot Point R1 | 0.6107 |
| Daily Pivot Point R2 | 0.6148 |
| Daily Pivot Point R3 | 0.6184 |
[/s2If]
Download Nehcap EAWe have two EAs that are operational on our LIVE accounts.
- EA-FIX: Check out the details here. Download EA-FIX . EA-FIX is a non-grid HFT scalper.
- EA-GROWTH: High quality low dd EA using trend grids. Download EA_GROWTHJoin Our Telegram Group
")


