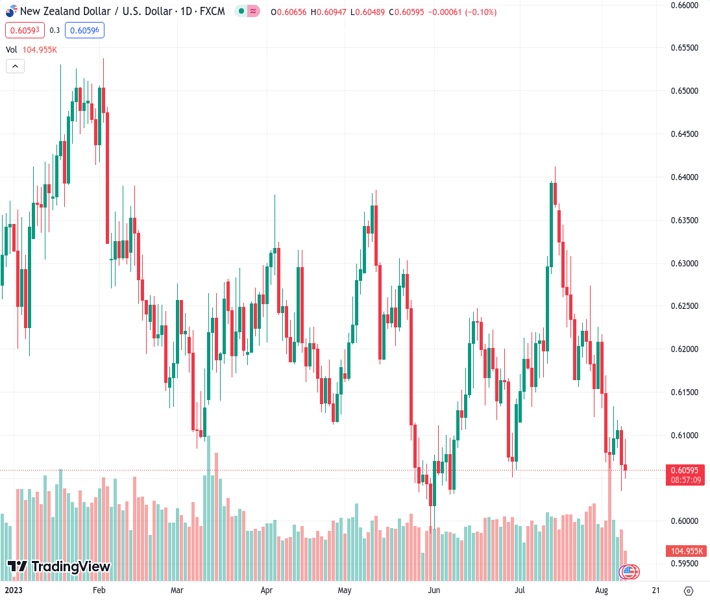
The NZD/USD pair, currently trading at 0.60588, experienced a significant decline from its earlier peak at 0.6090 due to the resurgence of negative market sentiment.
…
This is a premium post.
[s2If !current_user_can(access_s2member_level4)]Please register for FREE REGISTER to read full post below containing analysis. In case of any error or you think you are not able to read the full post below, please email us at support#nehcap.com [lwa][/s2If] [s2If current_user_can(access_s2member_level1)]
- NZD/USD falls back sharply from 0.6090 as bearish sentiment revives.
The pair currently trades last at 0.60588.
The previous day high was 0.6112 while the previous day low was 0.6035. The daily 38.2% Fib levels comes at 0.6064, expected to provide resistance. Similarly, the daily 61.8% fib level is at 0.6082, expected to provide resistance.
The NZD/USD pair faces barricades around 0.6090 in the London session. The Kiwi asset fails to test the round-level resistance of 0.6100 as the US Dollar Index (DXY) attempts a recovery move after building a support base around 102.30. The USD Index might attempt to recapture the immediate resistance of 102.80 amid supportive economic indicators.
S&P500 futures add some gains in the London session. It seems a recovery attempt by US equities after a sell-off on Tuesday. US indices felt selling pressure as investors hoped that inflation could rebound due to a stellar recovery in global oil prices. This would build more burden on households as their real income will squeeze.
The US Dollar Index is expected to enjoy a cautious market ahead of Consumer Price Index (CPI) data, which will be published on Thursday at 12:30 GMT. Sticky inflation figures for July are expected by the market participants due to strengthening oil prices. Also, sustained wage growth indicates that consumer spending remains resilient due to higher income for disposal.
The risk-aversion theme fails to sustain for longer despite Federal Reserve (Fed) policymakers delivering neutral interest rate guidance. Philadelphia Fed Bank President Patrick Harker said the central bank is at the point where it can be patient and hold rates steady and let the monetary policy actions do their work.
Meanwhile, the impact of recovery in inflationary pressures in the Chinese economy starts fading. China’s National Bureau of Statistics (NBS) reported early Wednesday that monthly CPI expanded at a 0.2% pace in July while investors anticipated a deflation of 0.1%. Producer Price Index (PPI) continued to deflate at a higher pace, recorded at 4.4%, more than expectations of 4.1%.
Chinese producers struggle to raise prices at factory gates amid bleak demand and declining exports. In spite of higher monetary and fiscal stimulus by the People’s Bank of China (PBoC) and the Chinese authority respectively, economic growth is sluggish.
It is worth noting that New Zealand is one of the leading trading partners of China and its weak domestic demand impacts the New Zealand Dollar.
Technical Levels: Supports and Resistances
NZDUSD currently trading at 0.6061 at the time of writing. Pair opened at 0.6066 and is trading with a change of -0.08 % .
| Overview | Overview.1 | |
|---|---|---|
| 0 | Today last price | 0.6061 |
| 1 | Today Daily Change | -0.0005 |
| 2 | Today Daily Change % | -0.0800 |
| 3 | Today daily open | 0.6066 |
The pair remains strongly bearish on the daily time frame. It trades below the 20 SMA @ 0.6203, 50 SMA 0.6166, 100 SMA @ 0.619 and 200 SMA @ 0.623.
| Trends | Trends.1 | |
|---|---|---|
| 0 | Daily SMA20 | 0.6203 |
| 1 | Daily SMA50 | 0.6166 |
| 2 | Daily SMA100 | 0.6190 |
| 3 | Daily SMA200 | 0.6230 |
The previous day high was 0.6112 while the previous day low was 0.6035. The daily 38.2% Fib levels comes at 0.6064, expected to provide resistance. Similarly, the daily 61.8% fib level is at 0.6082, expected to provide resistance.
Note the levels of interest below:
- Pivot support is noted at 0.6029, 0.5993, 0.5952
- Pivot resistance is noted at 0.6107, 0.6148, 0.6184
| Levels | Levels.1 |
|---|---|
| Previous Daily High | 0.6112 |
| Previous Daily Low | 0.6035 |
| Previous Weekly High | 0.6226 |
| Previous Weekly Low | 0.6060 |
| Previous Monthly High | 0.6413 |
| Previous Monthly Low | 0.6120 |
| Daily Fibonacci 38.2% | 0.6064 |
| Daily Fibonacci 61.8% | 0.6082 |
| Daily Pivot Point S1 | 0.6029 |
| Daily Pivot Point S2 | 0.5993 |
| Daily Pivot Point S3 | 0.5952 |
| Daily Pivot Point R1 | 0.6107 |
| Daily Pivot Point R2 | 0.6148 |
| Daily Pivot Point R3 | 0.6184 |
[/s2If]
Download Nehcap EAWe have two EAs that are operational on our LIVE accounts.
- EA-FIX: Check out the details here. Download EA-FIX . EA-FIX is a non-grid HFT scalper.
- EA-GROWTH: High quality low dd EA using trend grids. Download EA_GROWTHJoin Our Telegram Group
")


