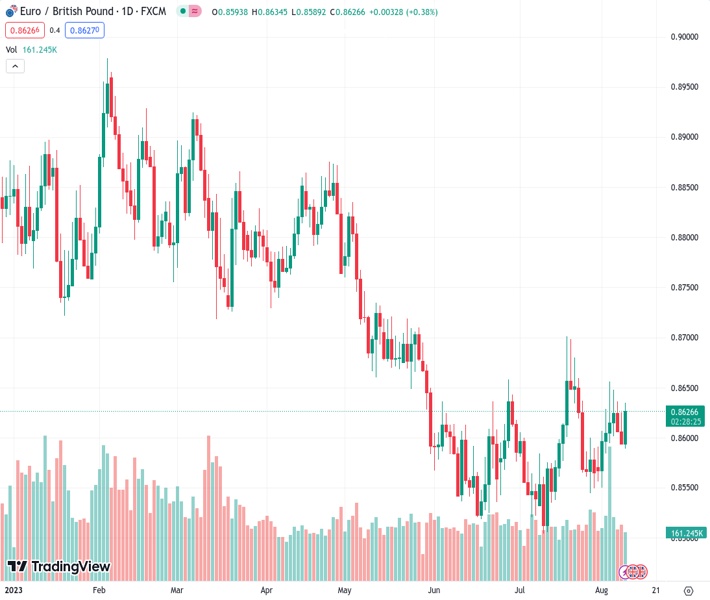
The EURGBP currency pair, with a value of 0.86264, experienced a recovery above the 20-day simple moving average (SMA) just below 0.8630. This resulted in gains of approximately 0.40%.
…
This is a premium post.
[s2If !current_user_can(access_s2member_level4)]Please register for FREE REGISTER to read full post below containing analysis. In case of any error or you think you are not able to read the full post below, please email us at support#nehcap.com [lwa][/s2If] [s2If current_user_can(access_s2member_level1)]
- EUR/GBP recovered the 20-day SMA rising near 0.8630, seeing nearly 0.40% gains.
The pair currently trades last at 0.86264.
The previous day high was 0.8626 while the previous day low was 0.8594. The daily 38.2% Fib levels comes at 0.8606, expected to provide support. Similarly, the daily 61.8% fib level is at 0.8613, expected to provide support.
At the middle of the week, the EUR/GBP recovered ground and jumped above the 20-day Simple Moving Average (SMA) of 0.8600. The EUR trades with gains against the USD, CHF, JPY, and AUD on higher German yields while the Pound trades soft.
On a quiet week, tightening expectations dictate the pace of the EUR/GBP cross, and rising German yields are pushing the pair higher. The 10-year bond yield rose to 2.47%, while the 2-year yield stands at 3.09% and the 5-year yielding 2.53%, respectively, making the EUR gain interest against its rivals. The focus now shifts to next week’s Q2 Gross Domestic Product (GDP) and inflation data from July from the European Union, which will help investors to model the next data-dependant European Central Bank (ECB) decision.
On the Pound’s side, GDP data on Friday will be key. The Bank of England reported in it last monetary policy statement that it no longer expects a recession, so the economic outlook in the UK will have an impact on the bets of market participants on the next BoE’s decision. As for now, they still bet, according to the World Interest Rate Possibilities (WIRP), a terminal rate of 5.75%, meaning an additional 50 basis point tightening for the rest of this cycle.
The daily chart suggests that the technical outlook is neutral to bullish for the short term as the bulls gain momentum, but buyers still have some work to do. The Relative Strength Index (RSI) has a positive slope in the bullish territory just above its midline, while the Moving Average Convergence (MACD) histogram displays increasing green bars. On the other hand, the pair is above the 20-day Simple Moving Average (SMA) but below the 100 and 200-day SMAs, indicating that there is still some light for the bulls but that the bears have the upperhand on the bigger picture.
Support levels: 0.8600 (20-day SMA), 0.8570, 0.8530.
Resistance levels: 0.8670 (100-day SMA), 0.8680, 0.8700
Technical Levels: Supports and Resistances
EURGBP currently trading at 0.8626 at the time of writing. Pair opened at 0.8594 and is trading with a change of 0.37 % .
| Overview | Overview.1 | |
|---|---|---|
| 0 | Today last price | 0.8626 |
| 1 | Today Daily Change | 0.0032 |
| 2 | Today Daily Change % | 0.3700 |
| 3 | Today daily open | 0.8594 |
The pair is trading above its 20 Daily moving average @ 0.86, above its 50 Daily moving average @ 0.8585 , below its 100 Daily moving average @ 0.8675 and below its 200 Daily moving average @ 0.8725
| Trends | Trends.1 | |
|---|---|---|
| 0 | Daily SMA20 | 0.8600 |
| 1 | Daily SMA50 | 0.8585 |
| 2 | Daily SMA100 | 0.8675 |
| 3 | Daily SMA200 | 0.8725 |
The previous day high was 0.8626 while the previous day low was 0.8594. The daily 38.2% Fib levels comes at 0.8606, expected to provide support. Similarly, the daily 61.8% fib level is at 0.8613, expected to provide support.
Note the levels of interest below:
- Pivot support is noted at 0.8584, 0.8573, 0.8552
- Pivot resistance is noted at 0.8615, 0.8636, 0.8647
| Levels | Levels.1 |
|---|---|
| Previous Daily High | 0.8626 |
| Previous Daily Low | 0.8594 |
| Previous Weekly High | 0.8656 |
| Previous Weekly Low | 0.8550 |
| Previous Monthly High | 0.8701 |
| Previous Monthly Low | 0.8504 |
| Daily Fibonacci 38.2% | 0.8606 |
| Daily Fibonacci 61.8% | 0.8613 |
| Daily Pivot Point S1 | 0.8584 |
| Daily Pivot Point S2 | 0.8573 |
| Daily Pivot Point S3 | 0.8552 |
| Daily Pivot Point R1 | 0.8615 |
| Daily Pivot Point R2 | 0.8636 |
| Daily Pivot Point R3 | 0.8647 |
[/s2If]
Download Nehcap EAWe have two EAs that are operational on our LIVE accounts.
- EA-FIX: Check out the details here. Download EA-FIX . EA-FIX is a non-grid HFT scalper.
- EA-GROWTH: High quality low dd EA using trend grids. Download EA_GROWTHJoin Our Telegram Group
")


