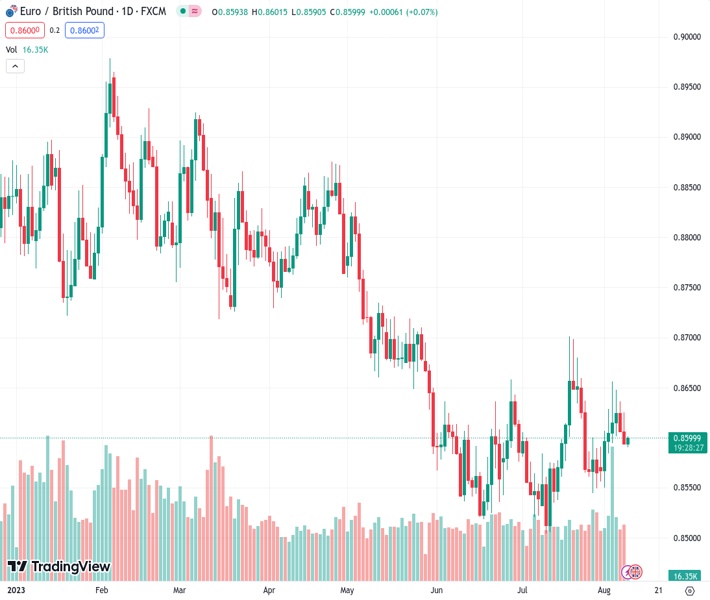
The EURGBP currency pair, which was at 0.85999, bounces back from a low it reached during the Asian session on Wednesday, after more than a week.
…
This is a premium post.
[s2If !current_user_can(access_s2member_level4)]Please register for FREE REGISTER to read full post below containing analysis. In case of any error or you think you are not able to read the full post below, please email us at support#nehcap.com [lwa][/s2If] [s2If current_user_can(access_s2member_level1)]
- EUR/GBP rebounds from over a one-week low touched during the Asian session on Wednesday.
The pair currently trades last at 0.85999.
The previous day high was 0.8626 while the previous day low was 0.8594. The daily 38.2% Fib levels comes at 0.8606, expected to provide resistance. Similarly, the daily 61.8% fib level is at 0.8613, expected to provide resistance.
The EUR/GBP cross stages a modest recovery from over a one-week low touched during the Asian session on Wednesday and retakes the 0.8600 round-figure mark in the last hour. Spot prices, for now, seem to have snapped a two-day losing streak, though the mixed fundamental backdrop warrants some caution before placing aggressive bullish bets.
A bleak outlook for the UK economy undermines the British Pound (GBP), which turns out to be a key factor that prompts some intraday short-covering around the EUR/GBP cross. In fact, the National Institute of Economic and Social Research (NIESR) said that there was a 60% risk of the government going to the polls during a recession. In its quarterly update, the NIESR added that it would take until the third quarter of 2024 for UK output to return to its pre-pandemic peak.
This comes after a report from the British Retail Consortium showed on Tuesday that UK Retail Sales in July registered its weakest year-on-year growth since August 2022. Furthermore, the Recruitment and Employment Confederation (REC) said on Monday that British employers reduced the number of new permanent staff they hired through agencies by the most since mid-2020. This, along with the Bank of England’s (BoE) less hawkish forward guidance, continues to undermine the GBP.
It is worth recalling that the BoE raised its key benchmark interest rate by 25 bps to a 15-year peak level of 5.25% last Thursday and signalled that the tightening cycle may be nearing an end. The UK central bank called its current monetary policy stance “restrictive” and forced investors to scale back expectations for the peak rate. However, speculations that the European Central Bank (ECB) will halt its streak of nine consecutive rate hikes in September might cap the upside for the EUR/GBP cross.
In fact, the ECB, in its economic bulletin published last Friday, noted that the underlying inflation in the region likely peaked during the first half of 2023. Adding to this, Fitch Ratings said on Friday that falling Euro Zone inflation puts ECB rates peak within sight. This makes it prudent to wait for strong follow-through buying before positioning for any further intraday appreciating move ahead of important UK macro releases, including the prelim Q2 GDP report, due on Friday.
Technical Levels: Supports and Resistances
EURGBP currently trading at 0.86 at the time of writing. Pair opened at 0.8594 and is trading with a change of 0.07 % .
| Overview | Overview.1 | |
|---|---|---|
| 0 | Today last price | 0.8600 |
| 1 | Today Daily Change | 0.0006 |
| 2 | Today Daily Change % | 0.0700 |
| 3 | Today daily open | 0.8594 |
The pair is trading below its 20 Daily moving average @ 0.86, above its 50 Daily moving average @ 0.8585 , below its 100 Daily moving average @ 0.8675 and below its 200 Daily moving average @ 0.8725
| Trends | Trends.1 | |
|---|---|---|
| 0 | Daily SMA20 | 0.8600 |
| 1 | Daily SMA50 | 0.8585 |
| 2 | Daily SMA100 | 0.8675 |
| 3 | Daily SMA200 | 0.8725 |
The previous day high was 0.8626 while the previous day low was 0.8594. The daily 38.2% Fib levels comes at 0.8606, expected to provide resistance. Similarly, the daily 61.8% fib level is at 0.8613, expected to provide resistance.
Note the levels of interest below:
- Pivot support is noted at 0.8584, 0.8573, 0.8552
- Pivot resistance is noted at 0.8615, 0.8636, 0.8647
| Levels | Levels.1 |
|---|---|
| Previous Daily High | 0.8626 |
| Previous Daily Low | 0.8594 |
| Previous Weekly High | 0.8656 |
| Previous Weekly Low | 0.8550 |
| Previous Monthly High | 0.8701 |
| Previous Monthly Low | 0.8504 |
| Daily Fibonacci 38.2% | 0.8606 |
| Daily Fibonacci 61.8% | 0.8613 |
| Daily Pivot Point S1 | 0.8584 |
| Daily Pivot Point S2 | 0.8573 |
| Daily Pivot Point S3 | 0.8552 |
| Daily Pivot Point R1 | 0.8615 |
| Daily Pivot Point R2 | 0.8636 |
| Daily Pivot Point R3 | 0.8647 |
[/s2If]
Download Nehcap EAWe have two EAs that are operational on our LIVE accounts.
- EA-FIX: Check out the details here. Download EA-FIX . EA-FIX is a non-grid HFT scalper.
- EA-GROWTH: High quality low dd EA using trend grids. Download EA_GROWTHJoin Our Telegram Group
")


