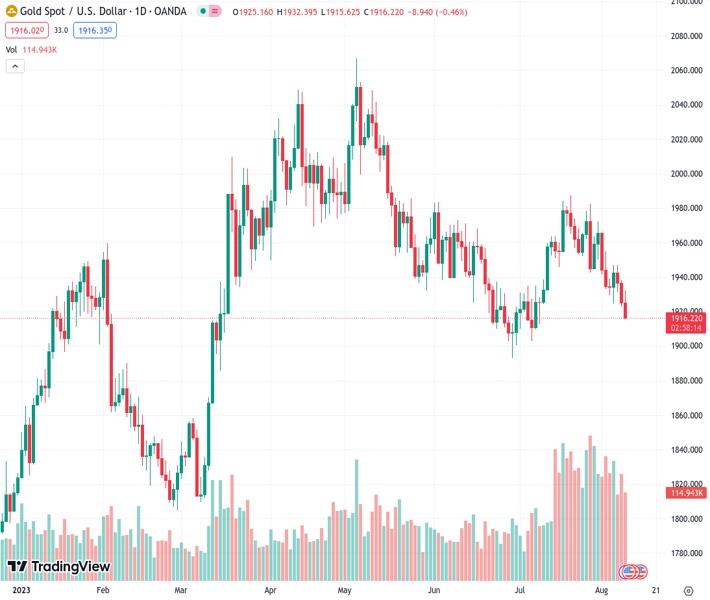
Gold prices (XAUUSD) at 1,916.29 experience a decrease of 0.39%, with traders eagerly anticipating US inflation data and aiming for the 200-day Exponential Moving Average (EMA).
…
This is a premium post.
[s2If !current_user_can(access_s2member_level4)]Please register for FREE REGISTER to read full post below containing analysis. In case of any error or you think you are not able to read the full post below, please email us at support#nehcap.com [lwa][/s2If] [s2If current_user_can(access_s2member_level1)]
- XAU/USD dips 0.39%, targeting the 200-day EMA as traders anxiously await US inflation numbers.
The pair currently trades last at 1916.29.
The previous day high was 1938.17 while the previous day low was 1922.83. The daily 38.2% Fib levels comes at 1928.69, expected to provide resistance. Similarly, the daily 61.8% fib level is at 1932.31, expected to provide resistance.
Gold price losses traction for the third straight day in the week tumbles 0.39% below its opening price as sellers eye a test of the 200-day Exponential Moving Average (EMA) at $1,908.12. Traders bracing for US inflation data release keep the yellow metal price depressed, exchanging hands at XAU/USD changes hands at $1,917.54.
The XAU/USD treads water ahead of the release of the July inflation report, which is expected to show the deflationary process remains intact. Estimates for the Consumer Price Index monthly and annually stand at 0.2% and 3%, respectively. Monthly data would remain unchanged from June’s, while year-over-year (YoY) would show an improvement from 3.3%. Excluding volatile items, the so-called core CPI is foreseen to remain at 0.2% MoM, with annual inflation estimated to be 4.8%, the same as in June.
However, XAU/USD buyers could remain hopeful for higher prices, as most Federal Reserve (Fed) officials have begun to turn neutral or even dovish, as shown by Philadelphia Fed President Patrick Harker stating that rates could remain at current levels, barring any deterioration on US economic data, said on Tuesday. Contrarily, Fed Governor Michelle Bowman stated the Fed needs to keep the pedal to the metal, lifting rates to curb inflation.
Expectations for a rate hike in September remained depressed, with odds at a 13.5% chance, as shown by the CME FedWatch Tool. Any Fed signals for rate cuts in 2024 could increase the appetite for the non-yielding metal, which is suffering from high US Treasury bond yields.
The US 10-year Treasury bond yield dives two basis points to 4.00% but remains above the figure, a headwind for XAU/USD, while the US Dollar Index (DXY), a measure of the greenback’s performance against its peers, loses traction, edges to 102.436, down 0.10%.
XAU/USD price is depressed after testing the lows of June at around $1,893.12, extended its gains toward the July 20 swing high at $1,987.42, though buyers’ failure to crack the latter exacerbated a pullback toward current gold price. On its way south, XAU/USD breached the 20, 50, and 100-day EMAs and as of writing, is breaking below a five-month-old support trendline that passes at around $1,922/$1,930. A daily close would expose the 200-day EMA, followed by the $1,900 figure.
From an oscillator’s view, the Relative Strength Index (RSI) and the three-day Rate of Change (RoC) suggest further downside expected as sellers remain in charge.
Technical Levels: Supports and Resistances
XAUUSD currently trading at 1916.66 at the time of writing. Pair opened at 1925.32 and is trading with a change of -0.45 % .
| Overview | Overview.1 | |
|---|---|---|
| 0 | Today last price | 1916.66 |
| 1 | Today Daily Change | -8.66 |
| 2 | Today Daily Change % | -0.45 |
| 3 | Today daily open | 1925.32 |
The pair is trading below its 20 Daily moving average @ 1954.76, below its 50 Daily moving average @ 1944.35 , below its 100 Daily moving average @ 1968.03 and above its 200 Daily moving average @ 1897.82
| Trends | Trends.1 | |
|---|---|---|
| 0 | Daily SMA20 | 1954.76 |
| 1 | Daily SMA50 | 1944.35 |
| 2 | Daily SMA100 | 1968.03 |
| 3 | Daily SMA200 | 1897.82 |
The previous day high was 1938.17 while the previous day low was 1922.83. The daily 38.2% Fib levels comes at 1928.69, expected to provide resistance. Similarly, the daily 61.8% fib level is at 1932.31, expected to provide resistance.
Note the levels of interest below:
- Pivot support is noted at 1919.38, 1913.43, 1904.04
- Pivot resistance is noted at 1934.72, 1944.11, 1950.06
| Levels | Levels.1 |
|---|---|
| Previous Daily High | 1938.17 |
| Previous Daily Low | 1922.83 |
| Previous Weekly High | 1972.45 |
| Previous Weekly Low | 1925.72 |
| Previous Monthly High | 1987.54 |
| Previous Monthly Low | 1902.77 |
| Daily Fibonacci 38.2% | 1928.69 |
| Daily Fibonacci 61.8% | 1932.31 |
| Daily Pivot Point S1 | 1919.38 |
| Daily Pivot Point S2 | 1913.43 |
| Daily Pivot Point S3 | 1904.04 |
| Daily Pivot Point R1 | 1934.72 |
| Daily Pivot Point R2 | 1944.11 |
| Daily Pivot Point R3 | 1950.06 |
[/s2If]
Download Nehcap EAWe have two EAs that are operational on our LIVE accounts.
- EA-FIX: Check out the details here. Download EA-FIX . EA-FIX is a non-grid HFT scalper.
- EA-GROWTH: High quality low dd EA using trend grids. Download EA_GROWTHJoin Our Telegram Group
")


