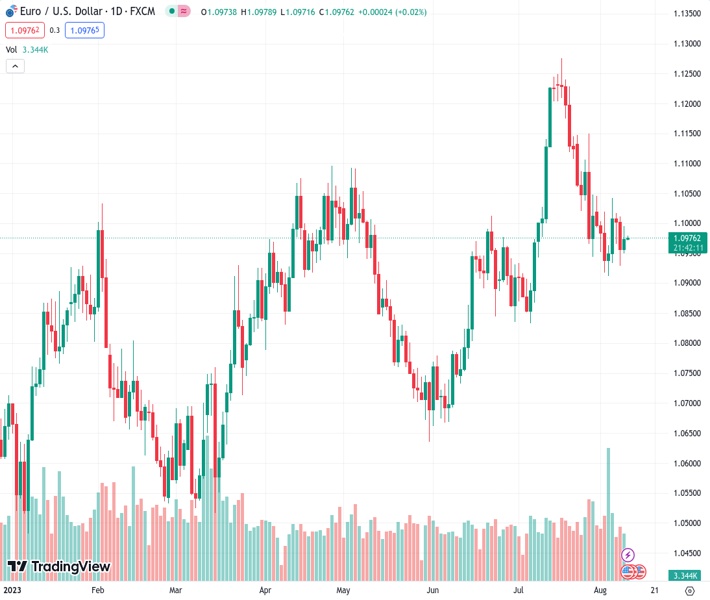
After breaking a two-day losing streak, the EURUSD pair is currently stagnant at 1.09763.
…
This is a premium post.
[s2If !current_user_can(access_s2member_level4)]Please register for FREE REGISTER to read full post below containing analysis. In case of any error or you think you are not able to read the full post below, please email us at support#nehcap.com [lwa][/s2If] [s2If current_user_can(access_s2member_level1)]
- EUR/USD remains sidelined after snapping a two-day losing streak the previous day.
The pair currently trades last at 1.09763.
The previous day high was 1.1011 while the previous day low was 1.0929. The daily 38.2% Fib levels comes at 1.0961, expected to provide support. Similarly, the daily 61.8% fib level is at 1.098, expected to provide resistance.
EUR/USD aptly portrays the pre-data anxiety as it seesaws around 1.0975-80 during the early hours of Thursday’s Asian session, struggling to extend the previous day’s corrective bounce from the weekly low. In doing so, the Euro pair justifies the mixed catalysts surrounding the US and Eurozone amid the looming fears of softer US inflation and the bloc’s recession woes, not to forget China deflation. Furthermore, the downbeat concerns about the European Central Bank (ECB) and the Federal Reserve (Fed) and prod the major currency pair, especially when the US Dollar retreats.
US Dollar Index (DXY) marked the first daily loss in three despite witnessing a corrective bounce by the end of Wednesday’s North American session to around 102.50. In doing so, the greenback’s gauge consolidates the weekly gains amid downbeat US MBA Mortgage Applications, as well as softer US Treasury bond yields.
On Wednesday, the US MBA Mortgage Applications dropped for the third consecutive week by posting -3.1% fall for the week ended on August 04, versus -3.0% prior. It’s worth noting that the solid mortgages previously fuelled the housing market and inflation, which in turn allowed the Fed to defend its hawkish bias.
Apart from the likely challenges to the Fed hawks, Biden Administration’s relief to China technology companies also helped ease the fears surrounding the Dragon Nation, joined by unimpressive China inflation data, to weigh on the US Dollar. “The US plans to target only those Chinese companies that get more than 50% of revenue from the sectors including quantum computing and artificial intelligence (AI),” said the news.
That said, an improvement in China’s Producer Price Index (PPI) for July superseded negative readings of the Consumer Price Index (CPI) for the said month. That said, CPI declines to -0.3% YoY versus -0.4% YoY expected and 0.0% prior whereas the PPI improves to -4.4% YoY compared to -4.1% YoY market forecasts and -5.4% previous readings.
Elsewhere, the CME Group FedWatch Tool shows that markets are pricing in an 86.5% chance that the Federal Reserve will pause interest rate hikes at its meeting in September.
At home, Italy’s surprise tax on windfall profits of banks joined previously released German statistics to suggest the looming recession in the bloc’s powerhouse. Further, the global rating agencies’ downward revision to the US banks and financial institutions weighs on the risk sentiment and the EUR/USD price despite the latest corrective bounce. On the same line could be fears of the UK recession and slowing economic growth in China, not to forget the Dragon Nation’s geopolitical tension with the US and Japan about Taiwan.
Against this backdrop, Wall Street closed on the negative side despite the downbeat performance of the US Treasury bond yields.
Moving on, the ECB’s monthly Economic Bulletin will be eyed closely amid economic fears surrounding the old continent, which if confirmed can recall the Euro bears. However, the reaction might be limited as traders are more interested in the United States inflation data, per the Consumer Price Index (CPI) for July. Market forecasts suggest an improvement in the headline CPI to 3.3% YoY versus 3.0% prior while the Core CPI, namely the CPI ex Food & Energy, may remain unchanged at 4.8%.
Also read: US CPI Preview: Forecasts from 10 major banks, monthly pace should hold at 0.2%
EUR/USD bulls need a clear upside break of a one-month-old descending resistance line surrounding 1.0970, as well as the 10-DMA level of around 1.0980, to keep the reins.
Technical Levels: Supports and Resistances
EURUSD currently trading at 1.0977 at the time of writing. Pair opened at 1.0956 and is trading with a change of 0.19% % .
| Overview | Overview.1 | |
|---|---|---|
| 0 | Today last price | 1.0977 |
| 1 | Today Daily Change | 0.0021 |
| 2 | Today Daily Change % | 0.19% |
| 3 | Today daily open | 1.0956 |
The pair is trading below its 20 Daily moving average @ 1.1077, above its 50 Daily moving average @ 1.0947 , above its 100 Daily moving average @ 1.0925 and above its 200 Daily moving average @ 1.0756
| Trends | Trends.1 | |
|---|---|---|
| 0 | Daily SMA20 | 1.1077 |
| 1 | Daily SMA50 | 1.0947 |
| 2 | Daily SMA100 | 1.0925 |
| 3 | Daily SMA200 | 1.0756 |
The previous day high was 1.1011 while the previous day low was 1.0929. The daily 38.2% Fib levels comes at 1.0961, expected to provide support. Similarly, the daily 61.8% fib level is at 1.098, expected to provide resistance.
Note the levels of interest below:
- Pivot support is noted at 1.092, 1.0884, 1.0838
- Pivot resistance is noted at 1.1002, 1.1048, 1.1084
| Levels | Levels.1 |
|---|---|
| Previous Daily High | 1.1011 |
| Previous Daily Low | 1.0929 |
| Previous Weekly High | 1.1046 |
| Previous Weekly Low | 1.0912 |
| Previous Monthly High | 1.1276 |
| Previous Monthly Low | 1.0834 |
| Daily Fibonacci 38.2% | 1.0961 |
| Daily Fibonacci 61.8% | 1.0980 |
| Daily Pivot Point S1 | 1.0920 |
| Daily Pivot Point S2 | 1.0884 |
| Daily Pivot Point S3 | 1.0838 |
| Daily Pivot Point R1 | 1.1002 |
| Daily Pivot Point R2 | 1.1048 |
| Daily Pivot Point R3 | 1.1084 |
[/s2If]
Download Nehcap EAWe have two EAs that are operational on our LIVE accounts.
- EA-FIX: Check out the details here. Download EA-FIX . EA-FIX is a non-grid HFT scalper.
- EA-GROWTH: High quality low dd EA using trend grids. Download EA_GROWTHJoin Our Telegram Group
")


