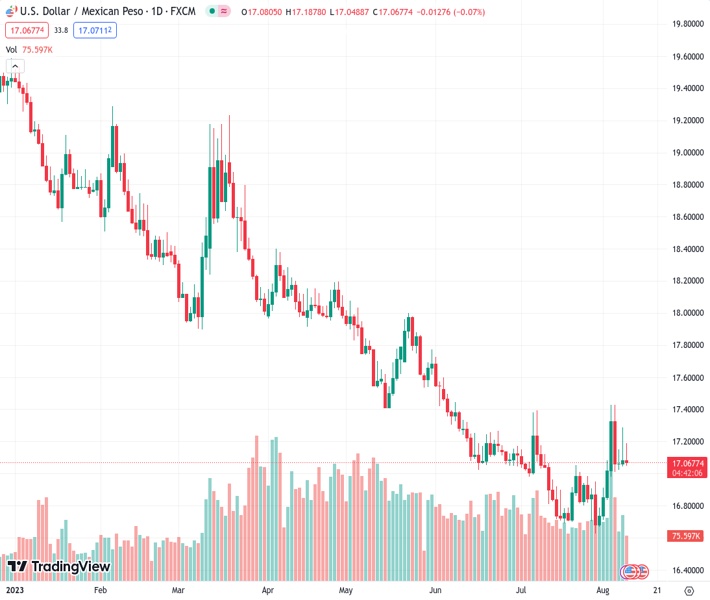
According to INEGI’s report, the Mexican peso exchange rate against the US dollar is currently at 17.0685. Mexico’s inflation is showing improvement, with the Consumer Price Index (CPI) decreasing consistently.
…
This is a premium post.
[s2If !current_user_can(access_s2member_level4)]Please register for FREE REGISTER to read full post below containing analysis. In case of any error or you think you are not able to read the full post below, please email us at support#nehcap.com [lwa][/s2If] [s2If current_user_can(access_s2member_level1)]
- Mexico’s inflation progress, as INEGI reports, CPI continuing its downtrend.
The pair currently trades last at 17.0685.
The previous day high was 17.2852 while the previous day low was 17.0519. The daily 38.2% Fib levels comes at 17.1961, expected to provide resistance. Similarly, the daily 61.8% fib level is at 17.141, expected to provide resistance.
The Mexican Peso (MXN) gains some traction as the USD/MXN pair edges lower after inflation data from Mexico portrays the deflationary process continues with success, ahead of Thursday’s monetary policy by the Bank of Mexico (Banxico). At the time of writing, the USD/MXN trades at 17.0830, down 0.14%.
The Instituto National of Estadistica Geografia e Informatica (INEGI) revealed the Consumer Price Index for July came below estimates of 0.49% MoM, at 0.48%, while annually based, hit 4.79%, as foreseen and a quarter of percentage below June’s figures. Nevertheless, as in most developed economies, core CPI is showing some stickiness, coming at 6.64% YoY, below estimates of 6.68%, and 0.25% beneath June’s 6.89%.
Following the inflation release, most analysts foresee Banxico’s holding rates unchanged at 11.25% on the August 10 monetary policy reunion. Pantheon Economics expects the first rate cut by Q4 2023.
Meanwhile, an absent US economic agenda would keep traders awaiting the release of the US inflation data. The Consumer Price Index (CPI) is expected to remain unchanged compared to June’s 0.2% MoM, while market analysts foresee a dip to 3% from 3.3% YoY. Core CPI is estimated to print 0.2% MoM as the prior month’s release, and YoY is projected to stay at 4.8% as June’s.
In the meantime, Federal Reserve officials begin to shift towards a neutral stance, led by Philadelphia Fed President Patrick Harker, saying the Fed is at a stage where it could keep rates unchanged unless data suggests the opposite. Contrarily, Fed Governor Michelle Bowman stated the Fed needs to keep the pedal to the metal, lifting rates to curb inflation.
Expectations for a rate hike in September remained depressed, with odds at a 15% chance, as shown by the CME FedWatch Tool.
The US Dollar Index (DXY), a gauge of the buck’s value against a basket of six currencies, is losing some traction, down by 0.11%, at 102.430, undermined by falling UST bond yields. The US 10-year benchmark note rate is 4.00%, down two basis points.
The USD/MXN is trading sideways above the 17.0000 figure for the fifth straight day, capped on the upside by the 50-day Exponential Moving Average (EMA) at 17.1308, while the figure and the 20-day EMA at 16.9849 act as support levels for the US Dollar bulls. If USD/MXN clears the 50-day EMA, that could exacerbate a move toward the crucial May 17 low of 17.4038, turned resistance. A daily close above the latter could pave the way to test the 100-day EMA at 17.4922. Conversely, if USD/MXN drops below the 20-day EMA, the pair could challenge the year-to-date (YTD) low of 16.6238.
Technical Levels: Supports and Resistances
USDMXN currently trading at 17.0814 at the time of writing. Pair opened at 17.0986 and is trading with a change of -0.1 % .
| Overview | Overview.1 | |
|---|---|---|
| 0 | Today last price | 17.0814 |
| 1 | Today Daily Change | -0.0172 |
| 2 | Today Daily Change % | -0.1000 |
| 3 | Today daily open | 17.0986 |
The pair is trading above its 20 Daily moving average @ 16.8994, below its 50 Daily moving average @ 17.088 , below its 100 Daily moving average @ 17.5277 and below its 200 Daily moving average @ 18.2884
| Trends | Trends.1 | |
|---|---|---|
| 0 | Daily SMA20 | 16.8994 |
| 1 | Daily SMA50 | 17.0880 |
| 2 | Daily SMA100 | 17.5277 |
| 3 | Daily SMA200 | 18.2884 |
The previous day high was 17.2852 while the previous day low was 17.0519. The daily 38.2% Fib levels comes at 17.1961, expected to provide resistance. Similarly, the daily 61.8% fib level is at 17.141, expected to provide resistance.
Note the levels of interest below:
- Pivot support is noted at 17.0052, 16.9118, 16.7718
- Pivot resistance is noted at 17.2386, 17.3786, 17.472
| Levels | Levels.1 |
|---|---|
| Previous Daily High | 17.2852 |
| Previous Daily Low | 17.0519 |
| Previous Weekly High | 17.4274 |
| Previous Weekly Low | 16.6694 |
| Previous Monthly High | 17.3957 |
| Previous Monthly Low | 16.6258 |
| Daily Fibonacci 38.2% | 17.1961 |
| Daily Fibonacci 61.8% | 17.1410 |
| Daily Pivot Point S1 | 17.0052 |
| Daily Pivot Point S2 | 16.9118 |
| Daily Pivot Point S3 | 16.7718 |
| Daily Pivot Point R1 | 17.2386 |
| Daily Pivot Point R2 | 17.3786 |
| Daily Pivot Point R3 | 17.4720 |
[/s2If]
Download Nehcap EAWe have two EAs that are operational on our LIVE accounts.
- EA-FIX: Check out the details here. Download EA-FIX . EA-FIX is a non-grid HFT scalper.
- EA-GROWTH: High quality low dd EA using trend grids. Download EA_GROWTHJoin Our Telegram Group
")


