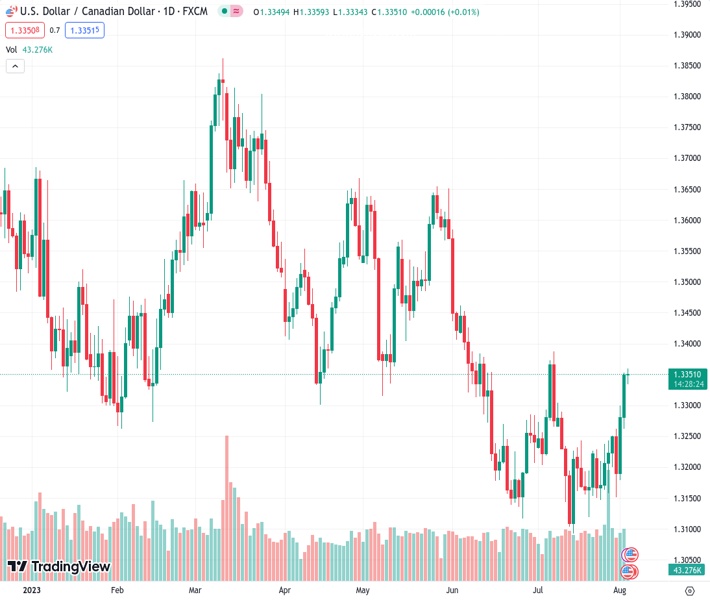
The USDCAD currency pair has reached a level of 1.33501, which is close to the highest point seen in July. This increase has occurred over the past two days, but there hasn’t been much movement recently.
…
This is a premium post.
[s2If !current_user_can(access_s2member_level4)]Please register for FREE REGISTER to read full post below containing analysis. In case of any error or you think you are not able to read the full post below, please email us at support#nehcap.com [lwa][/s2If] [s2If current_user_can(access_s2member_level1)]
- USD/CAD prods July’s peak after two-day uptrend, sidelined of late.
The pair currently trades last at 1.33501.
The previous day high was 1.3354 while the previous day low was 1.3266. The daily 38.2% Fib levels comes at 1.332, expected to provide support. Similarly, the daily 61.8% fib level is at 1.3299, expected to provide support.
USD/CAD buyers keep the reins around 1.3350, despite the latest inaction, as market players await the key US data heading into Thursday’s European session. In doing so, the Loonie pair seesaws at the highest levels in a month, flashed earlier in the day, while pausing a two-day winning streak.
That said, the quote’s latest inaction could be linked to a pullback in the WTI crude oil price, Canada’s main export item, as well as the lackluster moves of the US Dollar Index (DXY) ahead of the top-tier data.
WTI crude oil rose to the highest level since April 17 before ending the day with the heaviest losses in six weeks as risk aversion joined talks that the Oil producers won’t risk any more cuts to the output. On Wednesday, Reuters cited six OPEC and its allies (OPEC+) sources to report that the Oil cartel is expected to make no changes to its current oil output policy when they meet on Friday, August 4. It should be noted that the black gold prints a two-day downtrend near $79.20, down 0.40% intraday at the latest.
Elsewhere, the DXY cheered the risk-off mood and also benefited from the strong US Treasury bond yields on Wednesday to refresh a three-week high. Also likely to have favored the US Dollar Index bulls were the strong US ADP Employment Change numbers for July. However, failure to cross a nine-week-old resistance line limits the Greenback’s gauge versus the six major currencies to 102.60 at the latest.
Apart from the technical details, the US Treasury Secretary Janet Yellen and White House (WH) Economic Adviser Jared Bernstein’s defense of the US Treasury bonds may have tamed the previous risk-off mood and allow the USD/CAD pair to stabilize.
With this, US 10-year Treasury bond yields rose to the highest level since November 2022 whereas the Wall Street benchmarks closed in the red. That said, the S&P500 Futures remain sidelined at a two-week low after declining in the last two consecutive days.
Looking ahead, multiple US data surrounding employment and activity will be important to watch for the USD/CAD traders. Among them, US ISM Services PMI, Factory Orders, Weekly Initial Jobless Claims and quarterly readings of Nonfarm Productivity and Unit Labor Costs gain major attention.
A daily closing beyond the 50-DMA and a two-month-old previous resistance line, respectively near 1.3280 and 1.3295, keeps USD/CAD buyers hopeful of witnessing further upside.
Technical Levels: Supports and Resistances
USDCAD currently trading at 1.3353 at the time of writing. Pair opened at 1.335 and is trading with a change of 0.02% % .
| Overview | Overview.1 | |
|---|---|---|
| 0 | Today last price | 1.3353 |
| 1 | Today Daily Change | 0.0003 |
| 2 | Today Daily Change % | 0.02% |
| 3 | Today daily open | 1.335 |
The pair is trading above its 20 Daily moving average @ 1.3222, above its 50 Daily moving average @ 1.329 , below its 100 Daily moving average @ 1.3409 and below its 200 Daily moving average @ 1.3458
| Trends | Trends.1 | |
|---|---|---|
| 0 | Daily SMA20 | 1.3222 |
| 1 | Daily SMA50 | 1.3290 |
| 2 | Daily SMA100 | 1.3409 |
| 3 | Daily SMA200 | 1.3458 |
The previous day high was 1.3354 while the previous day low was 1.3266. The daily 38.2% Fib levels comes at 1.332, expected to provide support. Similarly, the daily 61.8% fib level is at 1.3299, expected to provide support.
Note the levels of interest below:
- Pivot support is noted at 1.3293, 1.3236, 1.3205
- Pivot resistance is noted at 1.3381, 1.3411, 1.3469
| Levels | Levels.1 |
|---|---|
| Previous Daily High | 1.3354 |
| Previous Daily Low | 1.3266 |
| Previous Weekly High | 1.3255 |
| Previous Weekly Low | 1.3147 |
| Previous Monthly High | 1.3387 |
| Previous Monthly Low | 1.3093 |
| Daily Fibonacci 38.2% | 1.3320 |
| Daily Fibonacci 61.8% | 1.3299 |
| Daily Pivot Point S1 | 1.3293 |
| Daily Pivot Point S2 | 1.3236 |
| Daily Pivot Point S3 | 1.3205 |
| Daily Pivot Point R1 | 1.3381 |
| Daily Pivot Point R2 | 1.3411 |
| Daily Pivot Point R3 | 1.3469 |
[/s2If]
Download Nehcap EAWe have two EAs that are operational on our LIVE accounts.
- EA-FIX: Check out the details here. Download EA-FIX . EA-FIX is a non-grid HFT scalper.
- EA-GROWTH: High quality low dd EA using trend grids. Download EA_GROWTHJoin Our Telegram Group
")


