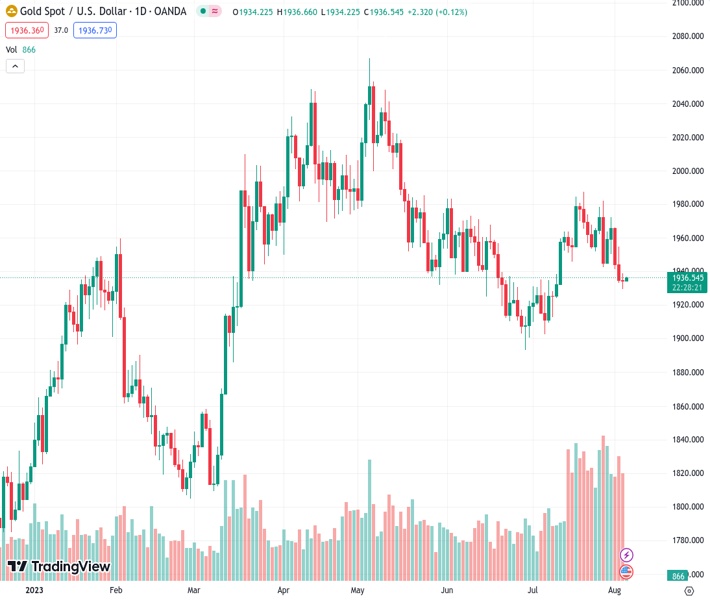
The price of gold, represented by #XAUUSD at 1,935.96, was negatively affected as the yield on the US 10-year Treasury bond increased by nine basis points to 4.179%. Additionally, real yields reached 1.99%, contributing to the downward pressure on gold prices.
…
This is a premium post.
[s2If !current_user_can(access_s2member_level4)]Please register for FREE REGISTER to read full post below containing analysis. In case of any error or you think you are not able to read the full post below, please email us at support#nehcap.com [lwa][/s2If] [s2If current_user_can(access_s2member_level1)]
- US Treasury Bond Yields Rise: The US 10-year Treasury bond yield climbed nine basis points to 4.179%, weighing on the gold price, while Real yields hit 1.99%.
The pair currently trades last at 1935.96.
The previous day high was 1954.85 while the previous day low was 1932.97. The daily 38.2% Fib levels comes at 1941.33, expected to provide resistance. Similarly, the daily 61.8% fib level is at 1946.49, expected to provide resistance.
Gold price strumbled for the third consecutive trading session and posted a three-week low as high US Treasury bond yields weighed on the non-yielding metal amidst a soft US Dollar (USD) during Thursday’s trading session. At the time of writing, the XAU/USD exchanges hands at $1,933.21, down 0.02%, as Friday’s Asian session commences.
Wall Street finished Thursday’s session with losses as US Treasury bond yield soared. The US 10-year Treasury bond yield rose nine basis points, up at 4.179%, but failed to underpin the greenback. US Real yields, which is nominal yields minus inflation expectations in 10 years, advanced and climbed ten basis points, up to 1.99%, its highest level since the week of July 3, when it hit 2.15%.
Data-wise, the US economic docket featured Initial Jobless Claims for the week ending July 29, hit 227K, as foreseen, a sign that even though it could encourage investors to bet the labor market is easing, releases in the latest three months, make difficult to asses the job market trend.
After that data release, the ISM Non-Manufacturing PMI for July decelerated to 52.7 from June’s 53.9 and missed estimates of 53. The data portrays business activity as slowing down, though it remains to be seen if the services segment in the US drops to recessionary territory.
Although data was mixed, US Treasury bond yields continued to climb. XAU/USD began the session at a nearby $1,938.72 before dropping toward the day lows amid a softer greenback.
XAU/USD traders focus on Friday’s July US Nonfarm Payrolls report release. Figures are expected to show the US economy added 200K jobs to the economy, with the Unemployment Rate expected to remain at 3.6%. Any upward deviations from the forecast could be positive for the buck and negative for XAU. That could weigh on Gold and put into play a test of the 200-day EMA at $1,907.49. On the contrary, XAU/USD could rally if the outcome misses estimates.
From a daily chart perspective, XAU/USD is neutral to downward biased once the yellow metal dipped below the 50, 20, and 100-day Exponential Moving Averages (EMAs), each at $$1950.18, 1,949.83, and $1,941.06. Although XAU/USD is testing the May 30 daily low of $1,932.20, a decisive break could expose a support trendline that passes around $1,915/20 before Gold reaches $1,900. Otherwise, if buyers hold prices above the former, first resistance would emerge at the 100-day EMA, followed by the confluence of the 20 and 50-day EMAs, at around $1,949-$1,950.
Technical Levels: Supports and Resistances
XAUUSD currently trading at 1934.62 at the time of writing. Pair opened at 1934.41 and is trading with a change of 0.01 % .
| Overview | Overview.1 | |
|---|---|---|
| 0 | Today last price | 1934.62 |
| 1 | Today Daily Change | 0.21 |
| 2 | Today Daily Change % | 0.01 |
| 3 | Today daily open | 1934.41 |
The pair is trading below its 20 Daily moving average @ 1952.49, below its 50 Daily moving average @ 1945.39 , below its 100 Daily moving average @ 1968.7 and above its 200 Daily moving average @ 1892.15
| Trends | Trends.1 | |
|---|---|---|
| 0 | Daily SMA20 | 1952.49 |
| 1 | Daily SMA50 | 1945.39 |
| 2 | Daily SMA100 | 1968.70 |
| 3 | Daily SMA200 | 1892.15 |
The previous day high was 1954.85 while the previous day low was 1932.97. The daily 38.2% Fib levels comes at 1941.33, expected to provide resistance. Similarly, the daily 61.8% fib level is at 1946.49, expected to provide resistance.
Note the levels of interest below:
- Pivot support is noted at 1926.64, 1918.86, 1904.76
- Pivot resistance is noted at 1948.52, 1962.62, 1970.4
| Levels | Levels.1 |
|---|---|
| Previous Daily High | 1954.85 |
| Previous Daily Low | 1932.97 |
| Previous Weekly High | 1982.20 |
| Previous Weekly Low | 1942.65 |
| Previous Monthly High | 1987.54 |
| Previous Monthly Low | 1902.77 |
| Daily Fibonacci 38.2% | 1941.33 |
| Daily Fibonacci 61.8% | 1946.49 |
| Daily Pivot Point S1 | 1926.64 |
| Daily Pivot Point S2 | 1918.86 |
| Daily Pivot Point S3 | 1904.76 |
| Daily Pivot Point R1 | 1948.52 |
| Daily Pivot Point R2 | 1962.62 |
| Daily Pivot Point R3 | 1970.40 |
[/s2If]
Download Nehcap EAWe have two EAs that are operational on our LIVE accounts.
- EA-FIX: Check out the details here. Download EA-FIX . EA-FIX is a non-grid HFT scalper.
- EA-GROWTH: High quality low dd EA using trend grids. Download EA_GROWTHJoin Our Telegram Group
")


