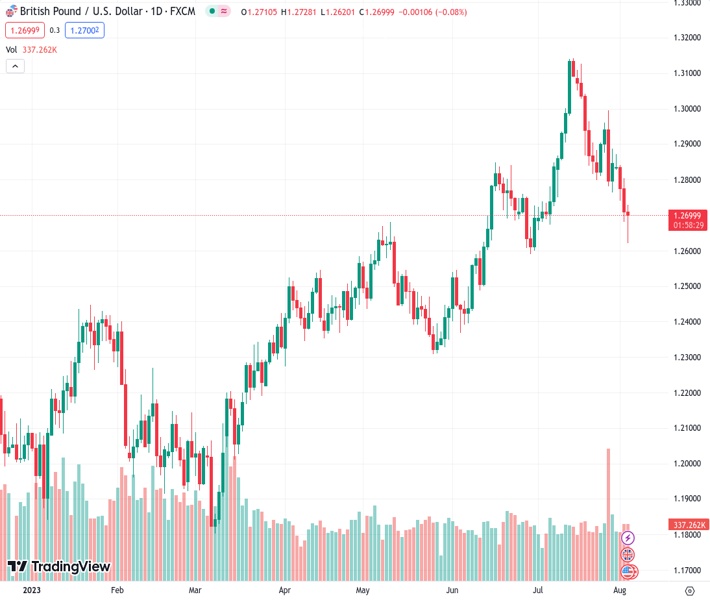
The GBPUSD is currently at a rate of 1.27001. The Bank of England has increased interest rates to 5.25%, but the currency has fallen to its lowest level in a month.
…
This is a premium post.
[s2If !current_user_can(access_s2member_level4)]Please register for FREE REGISTER to read full post below containing analysis. In case of any error or you think you are not able to read the full post below, please email us at support#nehcap.com [lwa][/s2If] [s2If current_user_can(access_s2member_level1)]
- BoE’s raises rates to 5.25%, though GBP/USD dipped to a one-month low.
The pair currently trades last at 1.27001.
The previous day high was 1.2806 while the previous day low was 1.268. The daily 38.2% Fib levels comes at 1.2728, expected to provide resistance. Similarly, the daily 61.8% fib level is at 1.2758, expected to provide resistance.
GBP/USD trims some of its earlier losses after the Bank of England (BoE) decided to raise rates by a quarter of a percentage point, as it warned borrowing costs will stay high. That, alongside business activity in the United States (US) slowing down, has lent a lifeline to the Sterling (GBP), which tumbled after BoE’s decision to a one-month low of 1.2620. At the time of writing, the GBP/USD is trading at 1.2705, registering minuscule losses of 0.04%.
The GBP/USD dived sharply after the BoE lited rates to 5.25% and warned, “The MPC will ensure that Bank Rate is sufficiently restrictive for sufficiently long to return inflation to the 2% target.” The BoE noted that although inflationary pressures are easing, the UK’s Consumer Price Index (CPI) remained at 7.9% in June, the highest in any major economy. In the meantime, market participants polled by Reuters expect UK Bank Rates to peak around 5.75%, indicating that two additional rate increases are expected toward the end of the year.
The BoE’s vote split was 6-3, with two members expecting a 50 bps hike, while Swati Dhingra voted to keep rates unchanged.
Aside from this, US economic data revealed the labor market gave signs of easing in the week ending July 29, with Initial Jobless Claims coming at 227K, aligned with estimates. Even though the data is encouraging, mixed reports during the last few months keep investors guessing the job market trend.
Other data released by the Institute for Supply Management (ISM) recently revealed that business services activity remains at expansionary territory at 52.7, below forecasts of 53, and trailed June’s 53.9. Even though data remains positive, it shows that activity is cooling down, putting on the table a recessionary scenario if consumers don’t support the economy.
Following the data, the greenback weakened as the GBP/USD gained some traction, trading back above 1.2700. Despite rising US Treasury bond yields, which had continued to edge higher, the US 10-year Treasury bond yield gained eleven basis points at 4.191%.
The upcoming US Nonfarm Payrolls report for July is anticipated to provide a comprehensive assessment of the labor market. If the report reveals unexpected positive outcomes, it may lead to discussions about implementing further interest rate hikes by the US Federal Reserve (Fed). Conversely, if the results fall short of expectations, the Fed might adopt a cautious approach in preparation for the September monetary policy meeting.
Meanwhile, Richmond’s Federal Reserve President, Thomas Barkin, made statements emphasizing the concern over high inflation levels. He mentioned that the inflation reading from the previous month was favorable, and he hopes it indicates a positive direction in managing inflationary pressures.
Technical Levels: Supports and Resistances
GBPUSD currently trading at 1.2706 at the time of writing. Pair opened at 1.2712 and is trading with a change of -0.05 % .
| Overview | Overview.1 | |
|---|---|---|
| 0 | Today last price | 1.2706 |
| 1 | Today Daily Change | -0.0006 |
| 2 | Today Daily Change % | -0.0500 |
| 3 | Today daily open | 1.2712 |
The pair is trading below its 20 Daily moving average @ 1.29, below its 50 Daily moving average @ 1.272 , above its 100 Daily moving average @ 1.2574 and above its 200 Daily moving average @ 1.2306
| Trends | Trends.1 | |
|---|---|---|
| 0 | Daily SMA20 | 1.2900 |
| 1 | Daily SMA50 | 1.2720 |
| 2 | Daily SMA100 | 1.2574 |
| 3 | Daily SMA200 | 1.2306 |
The previous day high was 1.2806 while the previous day low was 1.268. The daily 38.2% Fib levels comes at 1.2728, expected to provide resistance. Similarly, the daily 61.8% fib level is at 1.2758, expected to provide resistance.
Note the levels of interest below:
- Pivot support is noted at 1.2659, 1.2607, 1.2534
- Pivot resistance is noted at 1.2785, 1.2858, 1.291
| Levels | Levels.1 |
|---|---|
| Previous Daily High | 1.2806 |
| Previous Daily Low | 1.2680 |
| Previous Weekly High | 1.2996 |
| Previous Weekly Low | 1.2763 |
| Previous Monthly High | 1.3142 |
| Previous Monthly Low | 1.2659 |
| Daily Fibonacci 38.2% | 1.2728 |
| Daily Fibonacci 61.8% | 1.2758 |
| Daily Pivot Point S1 | 1.2659 |
| Daily Pivot Point S2 | 1.2607 |
| Daily Pivot Point S3 | 1.2534 |
| Daily Pivot Point R1 | 1.2785 |
| Daily Pivot Point R2 | 1.2858 |
| Daily Pivot Point R3 | 1.2910 |
[/s2If]
Download Nehcap EAWe have two EAs that are operational on our LIVE accounts.
- EA-FIX: Check out the details here. Download EA-FIX . EA-FIX is a non-grid HFT scalper.
- EA-GROWTH: High quality low dd EA using trend grids. Download EA_GROWTHJoin Our Telegram Group
")


