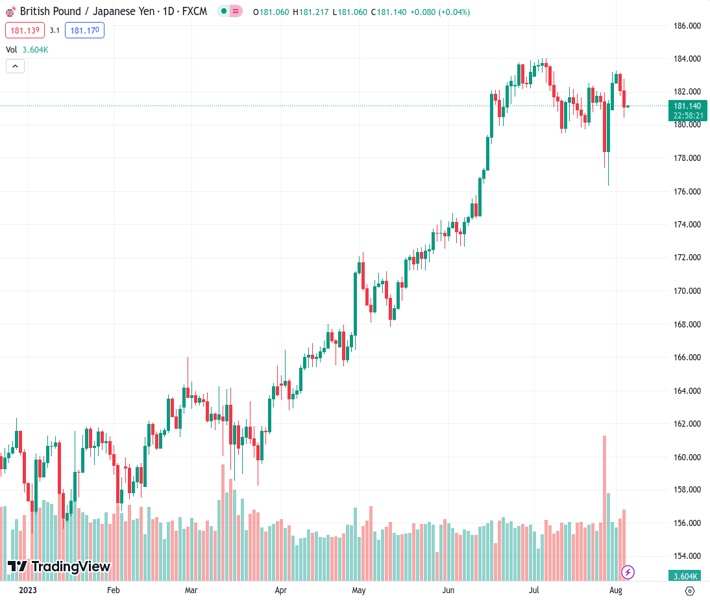
The GBPJPY pair has fallen for the second day in a row, nearing the 181.00 region.
…
This is a premium post.
[s2If !current_user_can(access_s2member_level4)]Please register for FREE REGISTER to read full post below containing analysis. In case of any error or you think you are not able to read the full post below, please email us at support#nehcap.com [lwa][/s2If] [s2If current_user_can(access_s2member_level1)]
- GBP/JPY declined for a second consecutive day, near the 181.00 area.
The pair currently trades last at 181.181.
The previous day high was 183.16 while the previous day low was 181.76. The daily 38.2% Fib levels comes at 182.29, expected to provide resistance. Similarly, the daily 61.8% fib level is at 182.62, expected to provide resistance.
The GBP/JPY declined towards the 181.00 area on Thursday, mainly driven by the JPY’s strength amid the expectations of a potential Bank of Japan (BoJ) tweak. On the other hand, the GBP weakened against most of its rivals following the Bank of England’s (BoE) decision.
As anticipated, the BoE increased the policy rate today by 25 bps, bringing the Bank Rate to 5.25%—two members for 50bp and one member voting for keeping the Bank Rate unchanged.
In the statement, the BoE acknowledged the potential risks of inflation increasing, especially concerning wage growth. Despite this, the bank pointed out that its current monetary policy is restrictive, and Andrew Bailey considered it is already having an “impact”. They also mentioned that they would maintain a sufficiently restrictive Bank Rate for a considerable duration to bring inflation back to the target of 2% in the medium term. This suggests that the BoE may prepare the financial markets for an upcoming pause or potential cuts.
Reacting to the decision, the British yields are seeing mixed movements. The 2-year rate declined to 4.93%, while the 5- and 10-year products stand at 4.44%, with the last one seeing more than a 1% increase.
On the other hand, the JPY is trading with gains against most of its rivals, mainly amid expectations of further tweaks on the Yield Control Curve (YCC) policy of the Bank of Japan (BoJ). On Thursday, the bank carried out an unexpected bond-buying operation, pushing the 10-year Japanese yield to a nine-year high of 0.65%. These movements hint at a potential monetary policy pivot. In the meantime, divergences in the financial policies between the BoE and BoJ should push the pair to the upside.
The daily chart highlights a neutral to bearish technical outlook for GBP/JPY, indicating possible bullish exhaustion. The Relative Strength Index (RSI) maintains a negative slope above its midline, and the Moving Average Convergence Divergence (MACD) prints a red bar. However, the pair is below the 20-day Simple Moving Average (SMA) but above the 100 and 200-day SMAs, suggesting that the bears struggle to challenge the overall bullish trend.
Support levels: 179.85, 179.00, 178.00.
Resistance levels: 181.40 (20-day SMA), 182.00, 183.00.
Technical Levels: Supports and Resistances
GBPJPY currently trading at 181.18 at the time of writing. Pair opened at 182.19 and is trading with a change of -0.55 % .
| Overview | Overview.1 | |
|---|---|---|
| 0 | Today last price | 181.18 |
| 1 | Today Daily Change | -1.01 |
| 2 | Today Daily Change % | -0.55 |
| 3 | Today daily open | 182.19 |
The pair is trading below its 20 Daily moving average @ 181.52, above its 50 Daily moving average @ 179.61 , above its 100 Daily moving average @ 173.19 and above its 200 Daily moving average @ 168.13
| Trends | Trends.1 | |
|---|---|---|
| 0 | Daily SMA20 | 181.52 |
| 1 | Daily SMA50 | 179.61 |
| 2 | Daily SMA100 | 173.19 |
| 3 | Daily SMA200 | 168.13 |
The previous day high was 183.16 while the previous day low was 181.76. The daily 38.2% Fib levels comes at 182.29, expected to provide resistance. Similarly, the daily 61.8% fib level is at 182.62, expected to provide resistance.
Note the levels of interest below:
- Pivot support is noted at 181.58, 180.97, 180.18
- Pivot resistance is noted at 182.98, 183.77, 184.38
| Levels | Levels.1 |
|---|---|
| Previous Daily High | 183.16 |
| Previous Daily Low | 181.76 |
| Previous Weekly High | 182.35 |
| Previous Weekly Low | 176.32 |
| Previous Monthly High | 184.02 |
| Previous Monthly Low | 176.32 |
| Daily Fibonacci 38.2% | 182.29 |
| Daily Fibonacci 61.8% | 182.62 |
| Daily Pivot Point S1 | 181.58 |
| Daily Pivot Point S2 | 180.97 |
| Daily Pivot Point S3 | 180.18 |
| Daily Pivot Point R1 | 182.98 |
| Daily Pivot Point R2 | 183.77 |
| Daily Pivot Point R3 | 184.38 |
[/s2If]
Download Nehcap EAWe have two EAs that are operational on our LIVE accounts.
- EA-FIX: Check out the details here. Download EA-FIX . EA-FIX is a non-grid HFT scalper.
- EA-GROWTH: High quality low dd EA using trend grids. Download EA_GROWTHJoin Our Telegram Group
")


