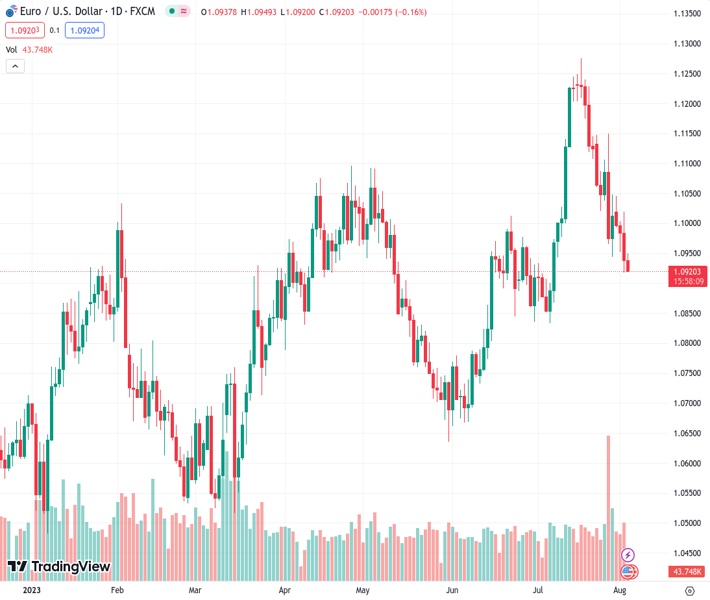
The EURUSD pair at a rate of 1.09235 continues its defensive stance for the fourth consecutive day and lingers close to a low point seen over several weeks.
…
This is a premium post.
[s2If !current_user_can(access_s2member_level4)]Please register for FREE REGISTER to read full post below containing analysis. In case of any error or you think you are not able to read the full post below, please email us at support#nehcap.com [lwa][/s2If] [s2If current_user_can(access_s2member_level1)]
- EUR/USD remains on the defensive for the fourth straight day and hangs near a multi-week low.
The pair currently trades last at 1.09235.
The previous day high was 1.102 while the previous day low was 1.0918. The daily 38.2% Fib levels comes at 1.0957, expected to provide resistance. Similarly, the daily 61.8% fib level is at 1.0981, expected to provide resistance.
The EUR/USD pair edges lower for the fourth successive day on Thursday and languishes near its lowest level since July 7 touched the previous day. Spot prices trade around the 1.0925-1.0920 region during the Asian session, with bearish still awaiting a break below a technically significant 100-day Simple Moving Average (SMA) before placing fresh bets.
The prospects for further policy tightening by the Federal Reserve (Fed) assist the US Dollar (USD) to stand tall near a four-week high, which, in turn, is seen as a key factor acting as a headwind for the EUR/USD pair. The incoming stronger US macro data, including the ADP report released on Wednesday, points to an extremely resilient US economy and lifts expectations that Fed will have enough headroom to keep interest rates higher for longer. The hawkish outlook keeps the yield on the benchmark 10-year US government bond elevated near its highest level since November and continues to underpin the buck.
The aforementioned supportive fundamental backdrop, to a larger extent, overshadows the Fitch downgrade of the US credit rating, though a modest recovery in the global risk sentiment caps gains for the safe-haven Greenback. This, in turn, is holding back traders from placing fresh bearish bets around the EUR/USD pair and helping limit the downside, at least for the time being. Any meaningful recovery, however, still seems elusive in the wake of expectations that the European Central Bank (ECB) may finally pause its historic hiking campaign soon. This, along with looming recession risks, could undermine the Euro.
It is worth recalling that ECB President Christine Lagarde, in an interview with the French daily Le Figaro published Sunday, stressed that no decision had yet been made about what the central bank will do at its next meeting on September 14. Lagarde added that the next policy move would be based on the latest economic and financial data. This comes after the headline Euro Zone CPI eased to the 5.3% YoY rate in July from the 5.5% previous. The so-called core inflation (excluding those for energy, food, alcohol and tobacco), however, proved a tad sticky and was up by 5.5%, the same as during the previous month.
Nevertheless, the fundamental backdrop seems tilted slightly in favour of bearish traders and supports prospects for an extension of the EUR/USD pair’s over a two-week-old downtrend from its highest level since February 2022. That said, it will still be prudent to wait for a sustained break and acceptance below the 100-day SMA before positioning for further losses. Traders now look to the US economic docket – featuring the Weekly Initial Jobless Claims, the ISM Services PMI and Factory Orders data for a fresh impetus. The focus, meanwhile, remains glued to the closely-watched US jobs data – the NFP report on Friday.
Technical Levels: Supports and Resistances
EURUSD currently trading at 1.0923 at the time of writing. Pair opened at 1.0938 and is trading with a change of -0.14 % .
| Overview | Overview.1 | |
|---|---|---|
| 0 | Today last price | 1.0923 |
| 1 | Today Daily Change | -0.0015 |
| 2 | Today Daily Change % | -0.1400 |
| 3 | Today daily open | 1.0938 |
The pair is trading below its 20 Daily moving average @ 1.1074, below its 50 Daily moving average @ 1.0926 , above its 100 Daily moving average @ 1.0913 and above its 200 Daily moving average @ 1.0734
| Trends | Trends.1 | |
|---|---|---|
| 0 | Daily SMA20 | 1.1074 |
| 1 | Daily SMA50 | 1.0926 |
| 2 | Daily SMA100 | 1.0913 |
| 3 | Daily SMA200 | 1.0734 |
The previous day high was 1.102 while the previous day low was 1.0918. The daily 38.2% Fib levels comes at 1.0957, expected to provide resistance. Similarly, the daily 61.8% fib level is at 1.0981, expected to provide resistance.
Note the levels of interest below:
- Pivot support is noted at 1.0898, 1.0857, 1.0796
- Pivot resistance is noted at 1.1, 1.1061, 1.1102
| Levels | Levels.1 |
|---|---|
| Previous Daily High | 1.1020 |
| Previous Daily Low | 1.0918 |
| Previous Weekly High | 1.1150 |
| Previous Weekly Low | 1.0944 |
| Previous Monthly High | 1.1276 |
| Previous Monthly Low | 1.0834 |
| Daily Fibonacci 38.2% | 1.0957 |
| Daily Fibonacci 61.8% | 1.0981 |
| Daily Pivot Point S1 | 1.0898 |
| Daily Pivot Point S2 | 1.0857 |
| Daily Pivot Point S3 | 1.0796 |
| Daily Pivot Point R1 | 1.1000 |
| Daily Pivot Point R2 | 1.1061 |
| Daily Pivot Point R3 | 1.1102 |
[/s2If]
Download Nehcap EAWe have two EAs that are operational on our LIVE accounts.
- EA-FIX: Check out the details here. Download EA-FIX . EA-FIX is a non-grid HFT scalper.
- EA-GROWTH: High quality low dd EA using trend grids. Download EA_GROWTHJoin Our Telegram Group
")


