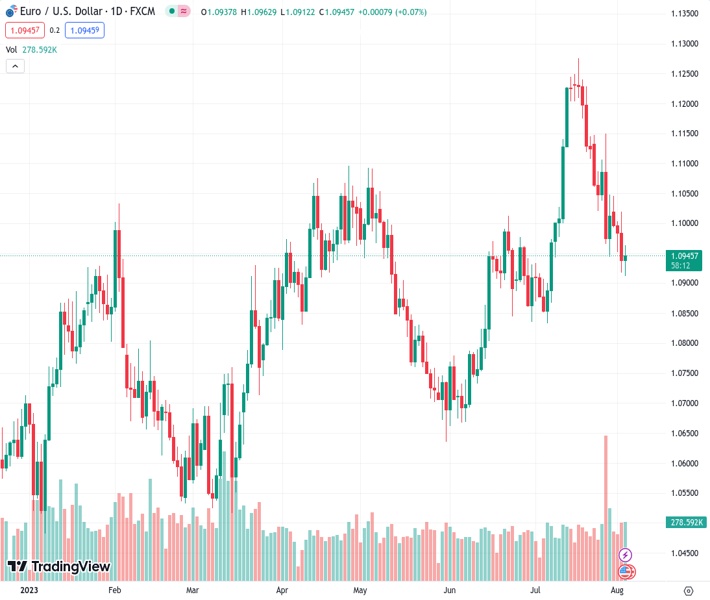
The EURUSD currency pair, which was initially at 1.09444, decreases to 1.0912 but then recovers before falling below 1.0900. It is currently being traded at 1.0942, showing a slight increase of 0.04% on Thursday.
…
This is a premium post.
[s2If !current_user_can(access_s2member_level4)]Please register for FREE REGISTER to read full post below containing analysis. In case of any error or you think you are not able to read the full post below, please email us at support#nehcap.com [lwa][/s2If] [s2If current_user_can(access_s2member_level1)]
- EUR/USD falls to 1.0912 but rebounds before breaching 1.0900, trading at 1.0942 with a slight gain of 0.04% on Thursday.
The pair currently trades last at 1.09444.
The previous day high was 1.102 while the previous day low was 1.0918. The daily 38.2% Fib levels comes at 1.0957, expected to provide resistance. Similarly, the daily 61.8% fib level is at 1.0981, expected to provide resistance.
The EUR/USD fell to a one-month-low of 1.0912 but bounced before breaching below the 1.0900 figure and is gaining traction, as the major gains 0.04% on Thursday. Hence, the EUR/USD is trading at 1.0942, about to form a doji, which depicts indecision among buyers and sellers.
It should be said the EUR/USD dropped below the 50-day Exponential Moving Average (EMA) at 1.0871, suggesting the pair is accelerating its downtrend, but the 100-day EMA at 1.0894 capped the EUR/USD’s fall to test the July 6 swing low of 1.0833. Despite the fact that the EUR/USD’s scenario is turning bearish, the pair might consolidate within the 1.0900/1.1000 area, as a downslope trendline passes around 1.1000, while the 100-day EMA could cushion the EUR/USD around 1.0900.
However, if EUR/USD extends its losses past the latter, the 100-day EMA around 1.0894 would be tested. A breach of the latter would immediately expose the July 6 low at 1.0833, followed by the 1.0800 figure, ahead of the 200-day EMA.
Conversely, if the EUR/USD reclaims the 50-day EMA at 1.0971, the 1,1000 figure would be up for grabs. Break above would set the stage to test the 29-day EMA at 1.1020, followed by the 1.1100 mark.
Oscillator-wise, the Relative Strength Index (RSI) remains in bearish territory, but its slope is almost turning neutral. The three-day Rate of Change (RoC) portrays a positive divergence, as the RoC aims upward, while EUR/USD’s price action extends its losses. Nevertheless, a doji emerging at around 1.0900 could signal buyers to enter the market.
Technical Levels: Supports and Resistances
EURUSD currently trading at 1.0942 at the time of writing. Pair opened at 1.0938 and is trading with a change of 0.04 % .
| Overview | Overview.1 | |
|---|---|---|
| 0 | Today last price | 1.0942 |
| 1 | Today Daily Change | 0.0004 |
| 2 | Today Daily Change % | 0.0400 |
| 3 | Today daily open | 1.0938 |
The pair is trading below its 20 Daily moving average @ 1.1074, above its 50 Daily moving average @ 1.0926 , above its 100 Daily moving average @ 1.0913 and above its 200 Daily moving average @ 1.0734
| Trends | Trends.1 | |
|---|---|---|
| 0 | Daily SMA20 | 1.1074 |
| 1 | Daily SMA50 | 1.0926 |
| 2 | Daily SMA100 | 1.0913 |
| 3 | Daily SMA200 | 1.0734 |
The previous day high was 1.102 while the previous day low was 1.0918. The daily 38.2% Fib levels comes at 1.0957, expected to provide resistance. Similarly, the daily 61.8% fib level is at 1.0981, expected to provide resistance.
Note the levels of interest below:
- Pivot support is noted at 1.0898, 1.0857, 1.0796
- Pivot resistance is noted at 1.1, 1.1061, 1.1102
| Levels | Levels.1 |
|---|---|
| Previous Daily High | 1.1020 |
| Previous Daily Low | 1.0918 |
| Previous Weekly High | 1.1150 |
| Previous Weekly Low | 1.0944 |
| Previous Monthly High | 1.1276 |
| Previous Monthly Low | 1.0834 |
| Daily Fibonacci 38.2% | 1.0957 |
| Daily Fibonacci 61.8% | 1.0981 |
| Daily Pivot Point S1 | 1.0898 |
| Daily Pivot Point S2 | 1.0857 |
| Daily Pivot Point S3 | 1.0796 |
| Daily Pivot Point R1 | 1.1000 |
| Daily Pivot Point R2 | 1.1061 |
| Daily Pivot Point R3 | 1.1102 |
[/s2If]
Download Nehcap EAWe have two EAs that are operational on our LIVE accounts.
- EA-FIX: Check out the details here. Download EA-FIX . EA-FIX is a non-grid HFT scalper.
- EA-GROWTH: High quality low dd EA using trend grids. Download EA_GROWTHJoin Our Telegram Group
")


