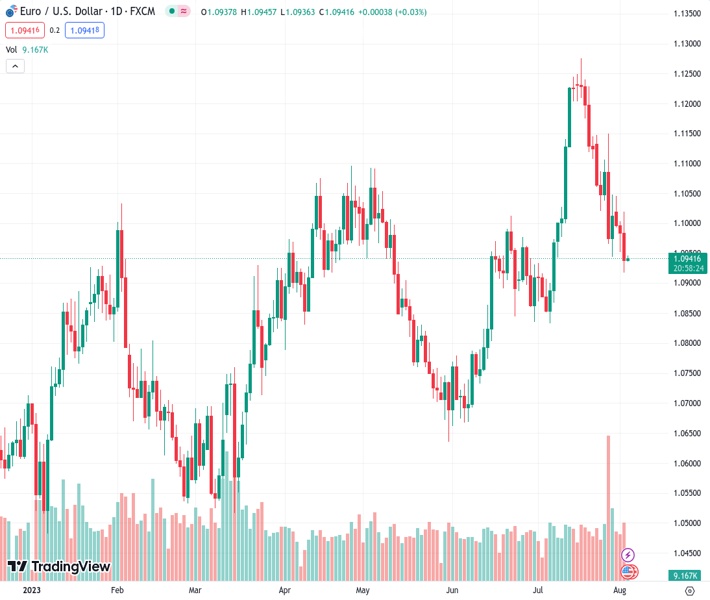
The EURUSD currency pair, trading at 1.09426, has found stability at its lowest point in the last month. This comes as it rebounds from its 100-day moving average (DMA) and attempts to reverse its three-day decline.
…
This is a premium post.
[s2If !current_user_can(access_s2member_level4)]Please register for FREE REGISTER to read full post below containing analysis. In case of any error or you think you are not able to read the full post below, please email us at support#nehcap.com [lwa][/s2If] [s2If current_user_can(access_s2member_level1)]
- EUR/USD stabilizes at the lowest level in a month as it bounces off 100-DMA to prod three-day downtrend.
The pair currently trades last at 1.09426.
The previous day high was 1.1003 while the previous day low was 1.0952. The daily 38.2% Fib levels comes at 1.0972, expected to provide resistance. Similarly, the daily 61.8% fib level is at 1.0984, expected to provide resistance.
EUR/USD seesaws around 1.0940-50 during the early hours of Thursday’s Asia session after declining to the lowest level in a month by posting a three-day downtrend in the last. In doing so, the Euro pair portrays the market’s cautious mood ahead of a slew of data from the Eurozone and the US. It’s worth noting that the risk aversion wave joins upbeat Treasury bond yields and an empty plate to offer from the bloc to underpin the US Dollar’s rally the previous day, which in turn dragged the Euro towards the lowest level since early July.
Fitch Ratings’ downgrade to the US government credit rating flagged fears of the US default and weighed on the sentiment, which in turn bolstered the US Dollar’s haven demand, drowning the EUR/USD pair due to its risk-barometer status. Apart from the haven demand, upbeat prints of the US ADP Employment Change and a run-up in the Treasury bond yields also pleased the Euro bears.
On Wednesday, US ADP Employment Change for July rose past 189K markets forecasts to 324K while the previous readings were revised down to 455K.
That said, US Treasury Secretary Janet Yellen and White House (WH) Economic Adviser Jared Bernstein defended the credibility of the US Treasury bonds and vouched for the US economic strength after Fitch Ratings’ cited such concerns as the catalysts for their downgrade to the US government credit ratings. On the same line, the US Treasury Department raised possibilities of testing demand for the US bonds after the rating cut by fueling the weekly longer-term debt issuance. The same pushed markets to remain worrisome and rush for risk safety.
Amid these plays, US 10-year Treasury bond yields rose to the highest level since November 2022 while the US Dollar Index (DXY) also jumped to a three-week top. Further, the Wall Street benchmarks also closed in the red and portrayed risk aversion.
Looking forward, Eurozone Producer Price Index (PPI) for June will precede the final activity data for July to entertain EUR/USD traders during early Thursday. Should the EU numbers flash upbeat data, the Euro pair may consolidate the latest losses.
Following that, the US ISM Services PMI, Factory Orders, Weekly Initial Jobless Claims and quarterly readings of Nonfarm Productivity and Unit Labor Costs will be crucial to watch for clear directions. It’s worth noting that the EUR/USD bears are more likely to witness further downside but it all depends upon how strongly the scheduled statistics defend the Federal Reserve’s (Fed) September rate hike.
A daily closing beneath the nine-week-old rising support line, now immediate resistance near 1.0985, keeps EUR/USD sellers hopeful even if the 100-DMA tests further downside around 1.0915.
Technical Levels: Supports and Resistances
EURUSD currently trading at 1.0943 at the time of writing. Pair opened at 1.0985 and is trading with a change of -0.38% % .
| Overview | Overview.1 | |
|---|---|---|
| 0 | Today last price | 1.0943 |
| 1 | Today Daily Change | -0.0042 |
| 2 | Today Daily Change % | -0.38% |
| 3 | Today daily open | 1.0985 |
The pair is trading below its 20 Daily moving average @ 1.107, above its 50 Daily moving average @ 1.0923 , above its 100 Daily moving average @ 1.091 and above its 200 Daily moving average @ 1.073
| Trends | Trends.1 | |
|---|---|---|
| 0 | Daily SMA20 | 1.1070 |
| 1 | Daily SMA50 | 1.0923 |
| 2 | Daily SMA100 | 1.0910 |
| 3 | Daily SMA200 | 1.0730 |
The previous day high was 1.1003 while the previous day low was 1.0952. The daily 38.2% Fib levels comes at 1.0972, expected to provide resistance. Similarly, the daily 61.8% fib level is at 1.0984, expected to provide resistance.
Note the levels of interest below:
- Pivot support is noted at 1.0957, 1.0929, 1.0906
- Pivot resistance is noted at 1.1008, 1.1031, 1.1058
| Levels | Levels.1 |
|---|---|
| Previous Daily High | 1.1003 |
| Previous Daily Low | 1.0952 |
| Previous Weekly High | 1.1150 |
| Previous Weekly Low | 1.0944 |
| Previous Monthly High | 1.1276 |
| Previous Monthly Low | 1.0834 |
| Daily Fibonacci 38.2% | 1.0972 |
| Daily Fibonacci 61.8% | 1.0984 |
| Daily Pivot Point S1 | 1.0957 |
| Daily Pivot Point S2 | 1.0929 |
| Daily Pivot Point S3 | 1.0906 |
| Daily Pivot Point R1 | 1.1008 |
| Daily Pivot Point R2 | 1.1031 |
| Daily Pivot Point R3 | 1.1058 |
[/s2If]
Download Nehcap EAWe have two EAs that are operational on our LIVE accounts.
- EA-FIX: Check out the details here. Download EA-FIX . EA-FIX is a non-grid HFT scalper.
- EA-GROWTH: High quality low dd EA using trend grids. Download EA_GROWTHJoin Our Telegram Group
")


