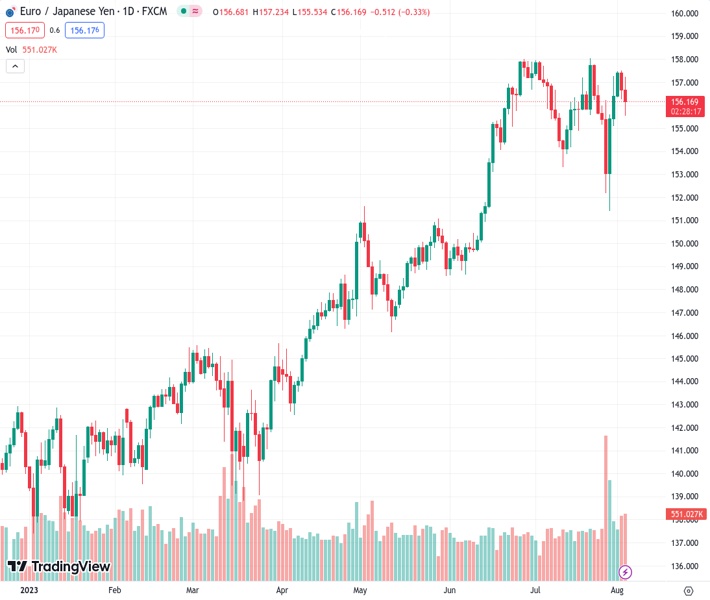
The EURJPY pair, currently trading at a rate of 156.186, experienced a decrease in value but managed to receive support at the 20-day Simple Moving Average (SMA) level of 155.75. However, the pair continues to sustain losses on a daily basis.
…
This is a premium post.
[s2If !current_user_can(access_s2member_level4)]Please register for FREE REGISTER to read full post below containing analysis. In case of any error or you think you are not able to read the full post below, please email us at support#nehcap.com [lwa][/s2If] [s2If current_user_can(access_s2member_level1)]
- EUR/JPY found support at the 20-day SMA at 155.75 but keeps daily losses.
The pair currently trades last at 156.186.
The previous day high was 157.5 while the previous day low was 156.26. The daily 38.2% Fib levels comes at 156.73, expected to provide resistance. Similarly, the daily 61.8% fib level is at 157.03, expected to provide resistance.
On Thursday, the EUR/JPY lost ground, retreating towards 156.00 but still holding the 20-day Simple Moving Average. The Euro weakened after soft Services PMIs released during the European sessions while the JPY strengthened on the back of expectations of the Bank of Japan (BoJ) turning hawkish.
Overall, the Service sector in the Eurozone slightly decelerated in July. The PMI service released by the S&P Global and Hamburg Commercial Bank (HCOB) from the Eurozone came in at 50.9 – lower than the 51.1 expected, while the German index showed strength, beating the expectations of 52, coming in at 52.3. In addition, the French, Italian and Spanish PMIs came in slightly below the consensus.
As a reaction, the EUR is trading weak against most of its rivals but rising German yields may limit the losses. The 10-year yield led the way, showing a 2.64% increase to 2.56%.
On the Japanese side, analysts at Rabobank see the USD/JPY retreating to 138.00 by year’s end. They predict that fundamental factors will eventually drive the BoJ to leave their accommodative stance, but only gradually. In the meantime, the bank has been sending mixed signals to the markets, and they recently held an unexpected bond-buying operation which made the 10-year JGB rise to multi-year highs, which may hint at a possible pivot.
Analysing the daily chart, a neutral-to-bearish technical outlook is evident for EUR/JPY, suggesting that the bulls are losing momentum. The Relative Strength Index (RSI) maintains a negative slope above its midline, and the Moving Average Convergence Divergence (MACD) showed a higher red bar. On the other hand, the pair is above the 20, 100 and 200-day SMAs, indicating a favourable position for the bulls in the bigger picture.
Support levels: 155.75, 155.00, 154.00.
Resistance levels: 156.50, 157.00, 157.50.
Technical Levels: Supports and Resistances
EURJPY currently trading at 156.16 at the time of writing. Pair opened at 156.77 and is trading with a change of -0.39 % .
| Overview | Overview.1 | |
|---|---|---|
| 0 | Today last price | 156.16 |
| 1 | Today Daily Change | -0.61 |
| 2 | Today Daily Change % | -0.39 |
| 3 | Today daily open | 156.77 |
The pair remains strongly bullish on the daily timeframe. It trades above its 20 SMA @ 155.83, 50 SMA 154.29, 100 SMA @ 150.27 and 200 SMA @ 146.62.
| Trends | Trends.1 | |
|---|---|---|
| 0 | Daily SMA20 | 155.83 |
| 1 | Daily SMA50 | 154.29 |
| 2 | Daily SMA100 | 150.27 |
| 3 | Daily SMA200 | 146.62 |
The previous day high was 157.5 while the previous day low was 156.26. The daily 38.2% Fib levels comes at 156.73, expected to provide resistance. Similarly, the daily 61.8% fib level is at 157.03, expected to provide resistance.
Note the levels of interest below:
- Pivot support is noted at 156.18, 155.6, 154.94
- Pivot resistance is noted at 157.43, 158.09, 158.68
| Levels | Levels.1 |
|---|---|
| Previous Daily High | 157.50 |
| Previous Daily Low | 156.26 |
| Previous Weekly High | 157.80 |
| Previous Weekly Low | 151.41 |
| Previous Monthly High | 158.05 |
| Previous Monthly Low | 151.41 |
| Daily Fibonacci 38.2% | 156.73 |
| Daily Fibonacci 61.8% | 157.03 |
| Daily Pivot Point S1 | 156.18 |
| Daily Pivot Point S2 | 155.60 |
| Daily Pivot Point S3 | 154.94 |
| Daily Pivot Point R1 | 157.43 |
| Daily Pivot Point R2 | 158.09 |
| Daily Pivot Point R3 | 158.68 |
[/s2If]
Download Nehcap EAWe have two EAs that are operational on our LIVE accounts.
- EA-FIX: Check out the details here. Download EA-FIX . EA-FIX is a non-grid HFT scalper.
- EA-GROWTH: High quality low dd EA using trend grids. Download EA_GROWTHJoin Our Telegram Group
")


