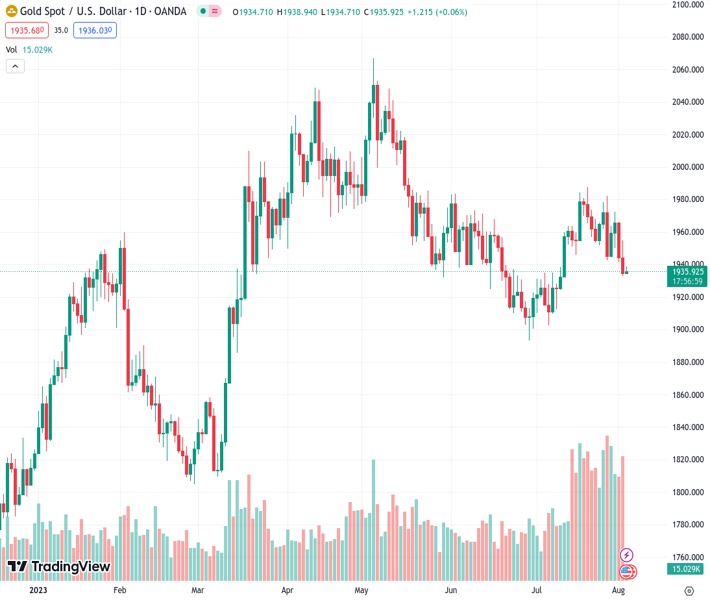
On Thursday, the price of gold, specifically at $1,935.91 in the XAUUSD market, showed some upward movement, but did not continue to increase significantly.
…
This is a premium post.
[s2If !current_user_can(access_s2member_level4)]Please register for FREE REGISTER to read full post below containing analysis. In case of any error or you think you are not able to read the full post below, please email us at support#nehcap.com [lwa][/s2If] [s2If current_user_can(access_s2member_level1)]
- Gold price gains some positive traction on Thursday, albeit lacks follow-through.
The pair currently trades last at 1935.91.
The previous day high was 1954.85 while the previous day low was 1932.97. The daily 38.2% Fib levels comes at 1941.33, expected to provide resistance. Similarly, the daily 61.8% fib level is at 1946.49, expected to provide resistance.
Gold price ticks higher during the Asian session on Thursday and reverses a part of the previous day’s decline to the $1,933-$1,932 region, or a three-week low. The XAU/USD currently trades with a mild positive bias around the $1,937-$1,938 area, up nearly 0.20% for the day, though any meaningful appreciating move still seems elusive.
The US Dollar (USD) enters a bullish consolidation phase and witnesses a subdued/range-bound price action near its highest level since July 7. This, in turn, is seen as a key factor lending some support to the US Dollar-denominated Gold price. The downside for the USD, meanwhile, remains cushioned in the wake of firming expectations that the Federal Reserve (Fed) will keep interest rates higher for longer. This, in turn, might hold back traders from placing aggressive bullish bets and cap the upside for the non-yielding yellow metal.
The ADP National Employment report showed on Wednesday that private-sector employers in the United States (US) added 324K jobs in July as compared to the 189K anticipated. This points to continued labour market resilience and should shield the economy from a recession, allowing the Fed to stick to its hawkish stance. The expectations keep the US Treasury bond yields elevated, which supports prospects for a further near-term move up for the USD and suggests that the path of least resistance for the Gold price is to the downside.
Investors, meanwhile, now seem to have digested the Fitch downgrade of the US government’s credit rating to AA+ from AAA late Tuesday. Adding to this, China’s Caixin Services PMI unexpectedly rose to 54.1 in July from 53.9 in the previous month and leads to a slight recovery in the global risk sentiment. This is evident from a modest rebound in the US equity futures, which might further contribute to keeping a lid on the safe-haven Gold price and adds credence to the negative outlook, warranting some caution for bullish traders.
Market participants now look forward to the US economic docket – featuring the release of the usual Weekly Initial Jobless Claims, the ISM Services PMI and Factory Orders later during the early North American session. This, along with the US bond yields, might influence the USD price dynamics and provide some impetus to the Gold price. Apart from this, traders will take cues from the broader risk sentiment to grab short-term opportunities, though the focus remains on the US jobs data, popularly known as the NFP report on Friday.
Technical Levels: Supports and Resistances
XAUUSD currently trading at 1937.87 at the time of writing. Pair opened at 1934.41 and is trading with a change of 0.18 % .
| Overview | Overview.1 | |
|---|---|---|
| 0 | Today last price | 1937.87 |
| 1 | Today Daily Change | 3.46 |
| 2 | Today Daily Change % | 0.18 |
| 3 | Today daily open | 1934.41 |
The pair is trading below its 20 Daily moving average @ 1952.49, below its 50 Daily moving average @ 1945.39 , below its 100 Daily moving average @ 1968.7 and above its 200 Daily moving average @ 1892.15
| Trends | Trends.1 | |
|---|---|---|
| 0 | Daily SMA20 | 1952.49 |
| 1 | Daily SMA50 | 1945.39 |
| 2 | Daily SMA100 | 1968.70 |
| 3 | Daily SMA200 | 1892.15 |
The previous day high was 1954.85 while the previous day low was 1932.97. The daily 38.2% Fib levels comes at 1941.33, expected to provide resistance. Similarly, the daily 61.8% fib level is at 1946.49, expected to provide resistance.
Note the levels of interest below:
- Pivot support is noted at 1926.64, 1918.86, 1904.76
- Pivot resistance is noted at 1948.52, 1962.62, 1970.4
| Levels | Levels.1 |
|---|---|
| Previous Daily High | 1954.85 |
| Previous Daily Low | 1932.97 |
| Previous Weekly High | 1982.20 |
| Previous Weekly Low | 1942.65 |
| Previous Monthly High | 1987.54 |
| Previous Monthly Low | 1902.77 |
| Daily Fibonacci 38.2% | 1941.33 |
| Daily Fibonacci 61.8% | 1946.49 |
| Daily Pivot Point S1 | 1926.64 |
| Daily Pivot Point S2 | 1918.86 |
| Daily Pivot Point S3 | 1904.76 |
| Daily Pivot Point R1 | 1948.52 |
| Daily Pivot Point R2 | 1962.62 |
| Daily Pivot Point R3 | 1970.40 |
[/s2If]
Download Nehcap EAWe have two EAs that are operational on our LIVE accounts.
- EA-FIX: Check out the details here. Download EA-FIX . EA-FIX is a non-grid HFT scalper.
- EA-GROWTH: High quality low dd EA using trend grids. Download EA_GROWTHJoin Our Telegram Group
")


