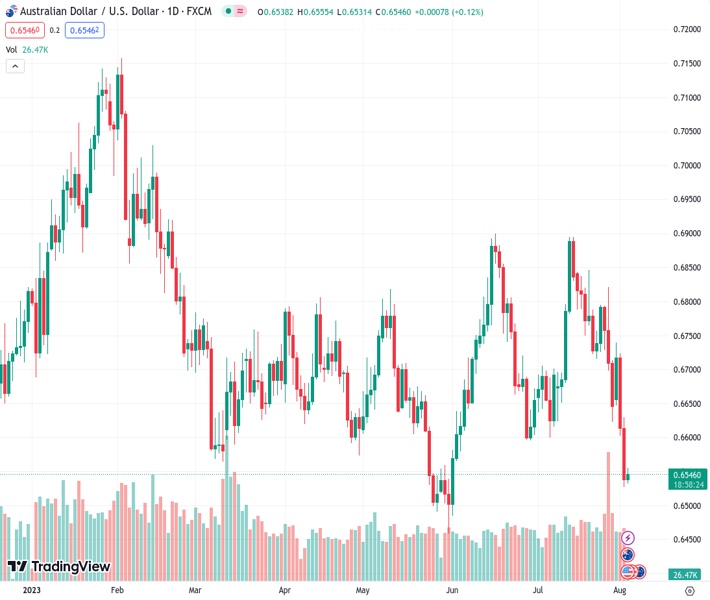
Despite bouncing off a low point from three weeks ago, AUDUSD at 0.65438 is having difficulty maintaining its recent gains.
…
This is a premium post.
[s2If !current_user_can(access_s2member_level4)]Please register for FREE REGISTER to read full post below containing analysis. In case of any error or you think you are not able to read the full post below, please email us at support#nehcap.com [lwa][/s2If] [s2If current_user_can(access_s2member_level1)]
- AUD/USD struggles to defend latest gains despite bouncing off three-week low.
The pair currently trades last at 0.65438.
The previous day high was 0.663 while the previous day low was 0.6527. The daily 38.2% Fib levels comes at 0.6566, expected to provide resistance. Similarly, the daily 61.8% fib level is at 0.6591, expected to provide resistance.
AUD/USD refreshes intraday high near 0.6560 while justifying the absence of major disappointment from the latest Australian and Chinese statistics during early Thursday. However, the Aussie pair lacks bullish bias amid a cautious mood ahead of a slew of US data.
That said, China’s Caixin Services PMI jumps to 54.1 in July from 53.9 prior and 52.5 market expectations.
Earlier in the day, the Australian Bureau of Statistics (ABS) unveiled details of the nation’s preliminary readings of the second quarter (Q2) Retail Sales and foreign trade numbers for June. The details suggest a slight improvement in the Aussie Q2 Retail Sales, to -0.5% QoQ from -0.6% prior, as well as a deterioration in the Trade Balance that eased to 11,321M compared to 11,791M in previous readouts and 11,000M expected.
It’s worth noting that the US Dollar Index (DXY) prints mild losses near 102.50 as bulls take a breather at the highest levels in three weeks. The Greenback’s latest retreat could be linked to its inability to cross a downward-sloping resistance line from May 31, around 102.75 at the latest, as well as the market’s preparations for the top-tier US data.
Furthermore, mild gains of the S&P500 Futures and a pullback in the US 10-year Treasury bond yields from the highest level since November 2022 also allow the AUD/USD pair to lick its wounds at the lowest level in three weeks.
It’s worth noting, however, that the bearish bias about the Reserve Bank of Australia (RBA) gains momentum and joins the market’s cautious mood to keep the Aussie pair sellers hopeful.
Looking forward, the market’s consolidation may allow the Aussie pair to defend the latest gains ahead of US ISM Services PMI, Factory Orders, Weekly Initial Jobless Claims and quarterly readings of Nonfarm Productivity and Unit Labor Costs.
Despite the latest corrective bounce amid the nearly oversold RSI (14), the AUD/USD bears keep the reins unless witnessing a daily close beyond the 10-month-old rising support line, now immediate resistance near 0.6590. With this, the sellers eye the yearly low marked in May around 0.6460.
Technical Levels: Supports and Resistances
AUDUSD currently trading at 0.6544 at the time of writing. Pair opened at 0.6538 and is trading with a change of 0.09% % .
| Overview | Overview.1 | |
|---|---|---|
| 0 | Today last price | 0.6544 |
| 1 | Today Daily Change | 0.0006 |
| 2 | Today Daily Change % | 0.09% |
| 3 | Today daily open | 0.6538 |
The pair remains strongly bearish on the daily time frame. It trades below the 20 SMA @ 0.6731, 50 SMA 0.67, 100 SMA @ 0.6692 and 200 SMA @ 0.6732.
| Trends | Trends.1 | |
|---|---|---|
| 0 | Daily SMA20 | 0.6731 |
| 1 | Daily SMA50 | 0.6700 |
| 2 | Daily SMA100 | 0.6692 |
| 3 | Daily SMA200 | 0.6732 |
The previous day high was 0.663 while the previous day low was 0.6527. The daily 38.2% Fib levels comes at 0.6566, expected to provide resistance. Similarly, the daily 61.8% fib level is at 0.6591, expected to provide resistance.
Note the levels of interest below:
- Pivot support is noted at 0.65, 0.6462, 0.6397
- Pivot resistance is noted at 0.6603, 0.6668, 0.6706
| Levels | Levels.1 |
|---|---|
| Previous Daily High | 0.6630 |
| Previous Daily Low | 0.6527 |
| Previous Weekly High | 0.6821 |
| Previous Weekly Low | 0.6623 |
| Previous Monthly High | 0.6895 |
| Previous Monthly Low | 0.6599 |
| Daily Fibonacci 38.2% | 0.6566 |
| Daily Fibonacci 61.8% | 0.6591 |
| Daily Pivot Point S1 | 0.6500 |
| Daily Pivot Point S2 | 0.6462 |
| Daily Pivot Point S3 | 0.6397 |
| Daily Pivot Point R1 | 0.6603 |
| Daily Pivot Point R2 | 0.6668 |
| Daily Pivot Point R3 | 0.6706 |
[/s2If]
Download Nehcap EAWe have two EAs that are operational on our LIVE accounts.
- EA-FIX: Check out the details here. Download EA-FIX . EA-FIX is a non-grid HFT scalper.
- EA-GROWTH: High quality low dd EA using trend grids. Download EA_GROWTHJoin Our Telegram Group
")


