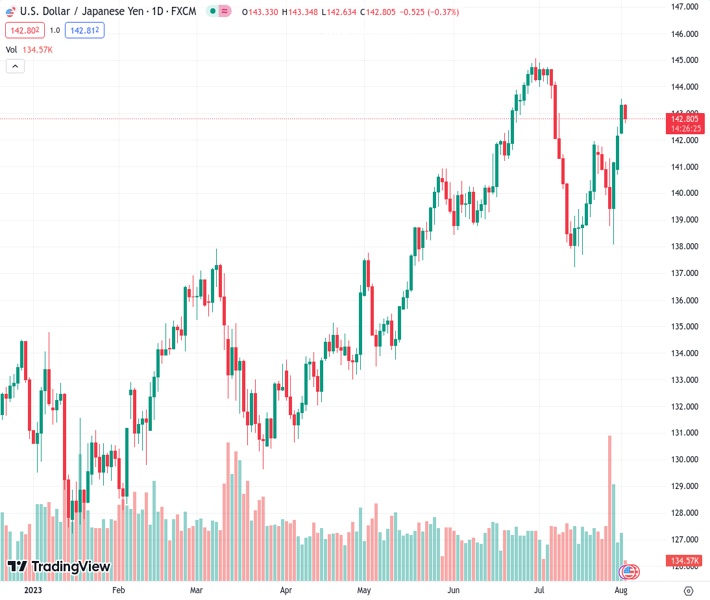
#USDJPY, trading at 142.849, experiences a decline after reaching its highest level in three weeks. This marked the first daily loss in four days due to a hawkish statement from BoJ’s Uchida. @nehcap predicts that the potential decrease in value will be minimal.
…
This is a premium post.
[s2If !current_user_can(access_s2member_level4)]Please register for FREE REGISTER to read full post below containing analysis. In case of any error or you think you are not able to read the full post below, please email us at support#nehcap.com [lwa][/s2If] [s2If current_user_can(access_s2member_level1)]
- USD/JPY reverses from three-week high, prints the first daily loss in four as BoJ’s Uchida sounds hawkish.
The pair currently trades last at 142.849.
The previous day high was 143.55 while the previous day low was 142.21. The daily 38.2% Fib levels comes at 143.04, expected to provide resistance. Similarly, the daily 61.8% fib level is at 142.72, expected to provide support.
USD/JPY slides to 142.80 as it fades bounce off intraday low heading into Wednesday’s European session. In doing so, the Yen pair reverses from the highest levels in three weeks while poking the 61.8% Fibonacci retracement of October 2022 to January 2023 downside.
That said, hawkish comments from Bank of Japan (BoJ) Deputy Governor Shinichi Uchida, suggesting a likely tweak to the central bank’s Yield Curve Control (YCC) policy, recently drowned the USD/JPY pair, which in turn snapped a three-day winning streak by the press time.
However, the key Fibonacci retracement level surrounding 142.50, also known as the golden Fibonacci ratio, challenges the USD/JPY bears amid bullish MACD signals.
Even if the quote drops below 142.50 support, the 21-DMA level of around 140.90 and the 140.00 psychological magnet will test the USD/JPY sellers.
Following that, the 50% Fibonacci retracement level and a four-month-old support line, near 139.60 and 138.70 in that order, will be in the spotlight.
On the contrary, a descending trend line from October 2022, close to 144.20 at the latest, precedes the yearly high of around 144.90 and the 145.00 round figure to challenge the USD/JPY buyers.
Trend: Limited downside expected
Technical Levels: Supports and Resistances
USDJPY currently trading at 142.89 at the time of writing. Pair opened at 143.33 and is trading with a change of -0.31% % .
| Overview | Overview.1 | |
|---|---|---|
| 0 | Today last price | 142.89 |
| 1 | Today Daily Change | -0.44 |
| 2 | Today Daily Change % | -0.31% |
| 3 | Today daily open | 143.33 |
The pair remains strongly bullish on the daily timeframe. It trades above its 20 SMA @ 140.79, 50 SMA 141.13, 100 SMA @ 137.6 and 200 SMA @ 136.64.
| Trends | Trends.1 | |
|---|---|---|
| 0 | Daily SMA20 | 140.79 |
| 1 | Daily SMA50 | 141.13 |
| 2 | Daily SMA100 | 137.60 |
| 3 | Daily SMA200 | 136.64 |
The previous day high was 143.55 while the previous day low was 142.21. The daily 38.2% Fib levels comes at 143.04, expected to provide resistance. Similarly, the daily 61.8% fib level is at 142.72, expected to provide support.
Note the levels of interest below:
- Pivot support is noted at 142.51, 141.69, 141.18
- Pivot resistance is noted at 143.85, 144.37, 145.19
| Levels | Levels.1 |
|---|---|
| Previous Daily High | 143.55 |
| Previous Daily Low | 142.21 |
| Previous Weekly High | 141.82 |
| Previous Weekly Low | 138.07 |
| Previous Monthly High | 144.91 |
| Previous Monthly Low | 137.24 |
| Daily Fibonacci 38.2% | 143.04 |
| Daily Fibonacci 61.8% | 142.72 |
| Daily Pivot Point S1 | 142.51 |
| Daily Pivot Point S2 | 141.69 |
| Daily Pivot Point S3 | 141.18 |
| Daily Pivot Point R1 | 143.85 |
| Daily Pivot Point R2 | 144.37 |
| Daily Pivot Point R3 | 145.19 |
[/s2If]
Download Nehcap EAWe have two EAs that are operational on our LIVE accounts.
- EA-FIX: Check out the details here. Download EA-FIX . EA-FIX is a non-grid HFT scalper.
- EA-GROWTH: High quality low dd EA using trend grids. Download EA_GROWTHJoin Our Telegram Group
")


