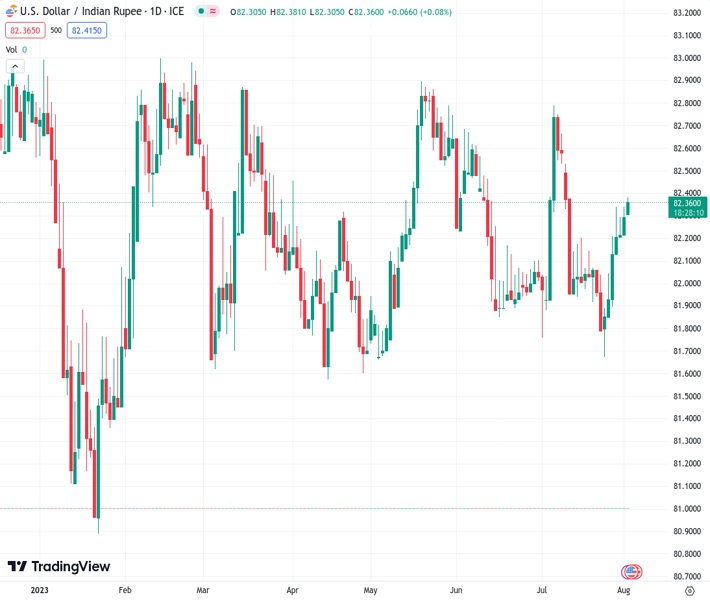
The USD to INR exchange rate of 82.3870 shows a three-day upwards movement, reaching the highest level since the beginning of July.
…
This is a premium post.
[s2If !current_user_can(access_s2member_level4)]Please register for FREE REGISTER to read full post below containing analysis. In case of any error or you think you are not able to read the full post below, please email us at support#nehcap.com [lwa][/s2If] [s2If current_user_can(access_s2member_level1)]
- USD/INR prints three-day uptrend at the highest level since early July.
The pair currently trades last at 82.3870.
The previous day high was 82.4257 while the previous day low was 82.224. The daily 38.2% Fib levels comes at 82.3487, expected to provide support. Similarly, the daily 61.8% fib level is at 82.3011, expected to provide support.
USD/INR clings to mild gains around 82.40 as it prints a three-day winning streak amid early Wednesday morning in Europe. In doing so, the Indian Rupee (INR) pair justifies the risk-off mood in the Asia-Pacific region, as well as the US Dollar’s hesitance in pushing back the bullish bias despite the US credit rating downgrade.
Late on Tuesday, global credit rating agency Fitch Ratings downgraded the US credit rating from AAA to AA+ by citing the debt crisis as the key catalyst. Following the announcement, the White House and US Treasury Secretary Janet Yellen rushed to criticize the move and defend the US Dollar by terming the move as inappropriate. On the same line, the recent market chatters, mainly from big bankers, suggest that such a rating cut is likely to have a minor negative impact on the US fundamentals and hence recently challenge the risk-off mood.
Further, the mixed US data and the Fed talks also put a floor under the US Dollar and propel the USD/INR price. On Tuesday, US ISM Manufacturing PMI for July improves to 46.4 from 46.0 prior, versus 46.8 expected. Further details unveil that ISM Manufacturing Employment Index slumped to 44.4 from 48.0 expected and 48.1 prior whereas the ISM Manufacturing Price Paid for the said month rose to 42.6 from 41.8, compared to 42.8 market forecasts. Elsewhere, the US JOLT Job Openings for June also eased to 9.582M compared to 9.62M expected and 9.616M previous readings (revised). On the other hand, Atlanta Federal Reserve Bank President Raphael Bostic crossed wires via Reuters while ruling out the need for a September rate hike while warning of the risk of over-tightening. Before him, Chicago Federal Reserve Bank President Austan Goolsbee sought more proof of inflation easing to support the end of rate hikes.
Amid these plays, stocks in the Asia-Pacific zone trade mixed with Japan’s Nikkei falling more than 1.5% while Chinese equities also print the red. However, shares in Australia and New Zealand print mild gains by the press time and prod the bears. It should be noted that Indian equities retreated in the last few days after refreshing the record top in July.
In addition to the risk-off mood and sturdy US Dollar, upbeat Oil price also propel the USD/INR price due to India’s reliance on energy imports. That said, WTI crude oil rises to a fresh high since April, up 0.10% intraday near $82.20 by the press time.
Moving on, the risk catalysts and the US ADP Employment Change for July, expected 189K versus 497K prior, will be crucial for intraday directions of the USD/INR pair amid a light calendar in India.
A successful break of the 200-SMA on the daily chart, around 82.15 by the press time, directs USD/INR buyers toward a downward-sloping resistance line from late May, close to 82.65 at the latest.
Technical Levels: Supports and Resistances
USDINR currently trading at 82.3855 at the time of writing. Pair opened at 82.3326 and is trading with a change of 0.06% % .
| Overview | Overview.1 | |
|---|---|---|
| 0 | Today last price | 82.3855 |
| 1 | Today Daily Change | 0.0529 |
| 2 | Today Daily Change % | 0.06% |
| 3 | Today daily open | 82.3326 |
The pair remains strongly bullish on the daily timeframe. It trades above its 20 SMA @ 82.2226, 50 SMA 82.244, 100 SMA @ 82.1976 and 200 SMA @ 82.1589.
| Trends | Trends.1 | |
|---|---|---|
| 0 | Daily SMA20 | 82.2226 |
| 1 | Daily SMA50 | 82.2440 |
| 2 | Daily SMA100 | 82.1976 |
| 3 | Daily SMA200 | 82.1589 |
The previous day high was 82.4257 while the previous day low was 82.224. The daily 38.2% Fib levels comes at 82.3487, expected to provide support. Similarly, the daily 61.8% fib level is at 82.3011, expected to provide support.
Note the levels of interest below:
- Pivot support is noted at 82.2292, 82.1258, 82.0275
- Pivot resistance is noted at 82.4309, 82.5292, 82.6326
| Levels | Levels.1 |
|---|---|
| Previous Daily High | 82.4257 |
| Previous Daily Low | 82.2240 |
| Previous Weekly High | 82.3860 |
| Previous Weekly Low | 81.6588 |
| Previous Monthly High | 82.8334 |
| Previous Monthly Low | 81.6588 |
| Daily Fibonacci 38.2% | 82.3487 |
| Daily Fibonacci 61.8% | 82.3011 |
| Daily Pivot Point S1 | 82.2292 |
| Daily Pivot Point S2 | 82.1258 |
| Daily Pivot Point S3 | 82.0275 |
| Daily Pivot Point R1 | 82.4309 |
| Daily Pivot Point R2 | 82.5292 |
| Daily Pivot Point R3 | 82.6326 |
[/s2If]
Download Nehcap EAWe have two EAs that are operational on our LIVE accounts.
- EA-FIX: Check out the details here. Download EA-FIX . EA-FIX is a non-grid HFT scalper.
- EA-GROWTH: High quality low dd EA using trend grids. Download EA_GROWTHJoin Our Telegram Group
")


