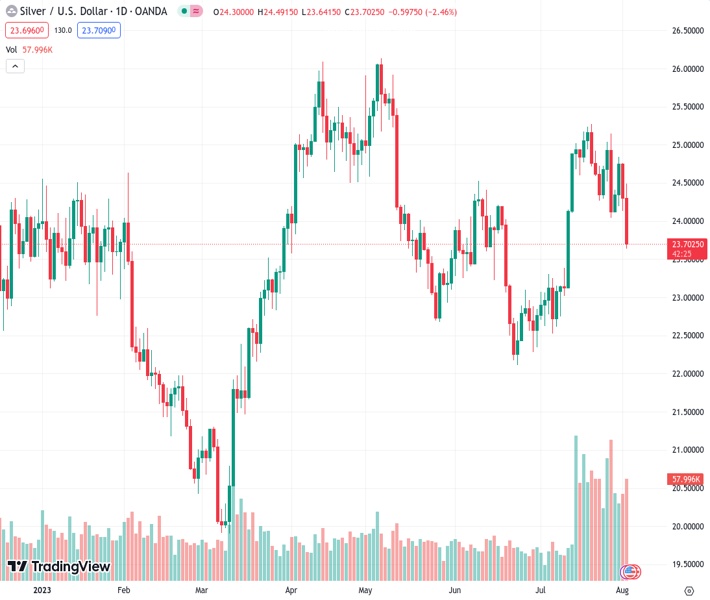
The price of XAGUSD dropped below $24.00, experiencing a decline of 2.40%.
…
This is a premium post.
[s2If !current_user_can(access_s2member_level4)]Please register for FREE REGISTER to read full post below containing analysis. In case of any error or you think you are not able to read the full post below, please email us at support#nehcap.com [lwa][/s2If] [s2If current_user_can(access_s2member_level1)]
- XAG/USD fell below $24.00, seeing losses of 2.40%.
The pair currently trades last at 23.707.
The previous day high was 24.76 while the previous day low was 24.13. The daily 38.2% Fib levels comes at 24.37, expected to provide resistance. Similarly, the daily 61.8% fib level is at 24.52, expected to provide resistance.
On Wednesday’s session, the XAG/USD Silver spot price fell to its lowest point since July 12 driven by a stronger USD to the $23.70 area. The DXY index is rising for a fifth consecutive day, mainly because the US economy is resilient and may push the Federal Reserve (Fed) not to halt its tightening cycle.
According to Automatic Data Processing Inc. (ADP), there were 324,000 employed people in the US in July, higher than the 189,000 expectations but lower than the revised number of 455,000 in June. As the labour market is still extremely tight, it may push the Fed to consider hiking in September, strengthening the USD.
In response, US bond yields and the opportunity cost of holding Silver are rising. The yields on the 5- and 10-year bonds increased by 4.26% and 4.10%, respectively, each by more than 1%. The 2-year yield increased by 0.60% on the day to 4.92%.
As for now, according to the CME FedWatch tool, markets anticipate that the Fed won’t hike in September and bet on a low odd of 20% of a 25 basis point hike, while the chances of a hike in November top out at 30% in November.
The daily chart analysis indicates a bearish outlook for the XAG/USD in the short term. The Relative Strength Index (RSI) is below its midline in negative territory, with a negative slope, aligning with the negative signal from the Moving Average Convergence Divergence (MACD), which displays red bars, reinforcing the strong bearish sentiment. On the other hand, the pair is below the 20 and 100-day Simple Moving Averages (SMAs), but above the 200-day SMA, indicating that the bulls aren’t done yet and that the outlook is still positive, looking at the bigger picture.
Support levels: $23.40,$23.15 (200-day SMA), $23.00.
Resistance levels. $24.00 (100-day SMA), $24.27 (20-day SMA), $24.50.
Technical Levels: Supports and Resistances
XAGUSD currently trading at 23.72 at the time of writing. Pair opened at 24.3 and is trading with a change of -2.39 % .
| Overview | Overview.1 | |
|---|---|---|
| 0 | Today last price | 23.72 |
| 1 | Today Daily Change | -0.58 |
| 2 | Today Daily Change % | -2.39 |
| 3 | Today daily open | 24.30 |
The pair is trading below its 20 Daily moving average @ 24.25, above its 50 Daily moving average @ 23.69 , below its 100 Daily moving average @ 23.99 and above its 200 Daily moving average @ 23.11
| Trends | Trends.1 | |
|---|---|---|
| 0 | Daily SMA20 | 24.25 |
| 1 | Daily SMA50 | 23.69 |
| 2 | Daily SMA100 | 23.99 |
| 3 | Daily SMA200 | 23.11 |
The previous day high was 24.76 while the previous day low was 24.13. The daily 38.2% Fib levels comes at 24.37, expected to provide resistance. Similarly, the daily 61.8% fib level is at 24.52, expected to provide resistance.
Note the levels of interest below:
- Pivot support is noted at 24.03, 23.76, 23.4
- Pivot resistance is noted at 24.67, 25.03, 25.3
| Levels | Levels.1 |
|---|---|
| Previous Daily High | 24.76 |
| Previous Daily Low | 24.13 |
| Previous Weekly High | 25.15 |
| Previous Weekly Low | 24.04 |
| Previous Monthly High | 25.27 |
| Previous Monthly Low | 22.52 |
| Daily Fibonacci 38.2% | 24.37 |
| Daily Fibonacci 61.8% | 24.52 |
| Daily Pivot Point S1 | 24.03 |
| Daily Pivot Point S2 | 23.76 |
| Daily Pivot Point S3 | 23.40 |
| Daily Pivot Point R1 | 24.67 |
| Daily Pivot Point R2 | 25.03 |
| Daily Pivot Point R3 | 25.30 |
[/s2If]
Download Nehcap EAWe have two EAs that are operational on our LIVE accounts.
- EA-FIX: Check out the details here. Download EA-FIX . EA-FIX is a non-grid HFT scalper.
- EA-GROWTH: High quality low dd EA using trend grids. Download EA_GROWTHJoin Our Telegram Group
")


