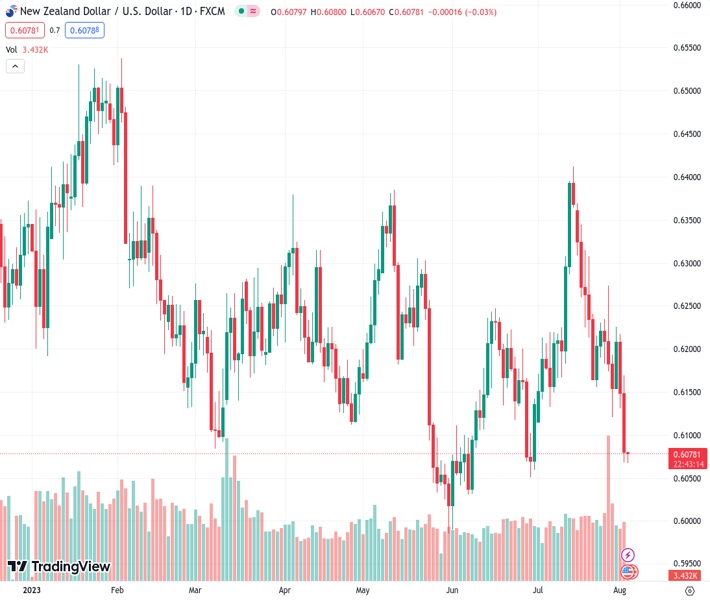
The NZDUSD pair, trading at 0.60781, has experienced a significant decrease of over 1%, following a previous daily peak of 0.6169.
…
This is a premium post.
[s2If !current_user_can(access_s2member_level4)]Please register for FREE REGISTER to read full post below containing analysis. In case of any error or you think you are not able to read the full post below, please email us at support#nehcap.com [lwa][/s2If] [s2If current_user_can(access_s2member_level1)]
- NZD/USD has taken a hit, declining by more than 1%, with a daily high previously at 0.6169.
The pair currently trades last at 0.60781.
The previous day high was 0.6219 while the previous day low was 0.6131. The daily 38.2% Fib levels comes at 0.6165, expected to provide resistance. Similarly, the daily 61.8% fib level is at 0.6186, expected to provide resistance.
NZD/USD plunged more than 1% on Wednesday, courtesy of a risk-off impulse as US credit rating was downgraded by Fitch, sparking a jump in US Treasury bond yields. That, alongside a solid July ADP National Employment report, boosted appetite for the US Dollar (USD). Hence, the NZD/USD slumps toward 0.6077 at the time of writing after reaching a daily high of 0.6169.
Market sentiment was dampened after Tuesday’s Fitch Ratings downgraded US creditworthiness from AAA to AA+ “on a perceived deterioration in US governance, which it said gave less confidence in the government’s ability to address fiscal and debt issues,” according to the report. After the release, traders seeking refugee bought the US Dollar (USD) and the Japanese Yen (JPY) in the FX space.
Earlier, data revealed by ADP revealed that private hiring in July improved sharply, with the economy adding 324K jobs smashing 189K estimates, ahead of Friday’s US Nonfarm Payrolls report. According to a Reuters poll, the US economy created 200K jobs, as revealed by analysts. In other data, July’s manufacturing activity continued to improve in the US, as the ISM shows, arriving at 46.4, below 46.8 estimates but exceeding June’s 46.0.
On the New Zealand (NZ) front, labor market data for the second quarter (Q2) of 2023 was soft. The Unemployment rate rose by 3.6% above 3.5% estimates, and wages, including and excluding overtime, came in at 1.1% q/q vs. 1.2% expected and 0.9% in Q1. Regarding Average hourly earnings, they came at 1.9% QoQ below Q1 2.1%, supporting the Reserve Bank of New Zealand’s (RBNZ) decision to finish its tightening cycle. The swaps market suggests the RBNZ would keep rates unchanged for August and October, but November is still open. Nevertheless, if data remains weak, the RBNZ will hold rates at the current level.
From a daily chart standpoint, the NZD/USD has turned bearish since the start of the week, dropping below the 200, 100, and 20-day Exponential Moving Averages (EMAs), spurring a 146 pip drop. Also, the NZD/USD breaking below the two-month-old upslope support trendline opened the door to test year-to-date (YTD) lows of 0.5985, but sellers must conquer demand zones on its way down. Firstly the June 29 daily low of 0.6050, followed by June’s 8 low of 0.6045, ahead of 0.6000. On the other hand, if NZD/USD stays above 0.6100, that could pave the way to test the psychological 0.6150, ahead of challenging a busy area with the daily EMAs hovering around 0.6200.
Technical Levels: Supports and Resistances
NZDUSD currently trading at 0.6079 at the time of writing. Pair opened at 0.615 and is trading with a change of -1.15 % .
| Overview | Overview.1 | |
|---|---|---|
| 0 | Today last price | 0.6079 |
| 1 | Today Daily Change | -0.0071 |
| 2 | Today Daily Change % | -1.1500 |
| 3 | Today daily open | 0.6150 |
The pair remains strongly bearish on the daily time frame. It trades below the 20 SMA @ 0.623, 50 SMA 0.6164, 100 SMA @ 0.6197 and 200 SMA @ 0.6224.
| Trends | Trends.1 | |
|---|---|---|
| 0 | Daily SMA20 | 0.6230 |
| 1 | Daily SMA50 | 0.6164 |
| 2 | Daily SMA100 | 0.6197 |
| 3 | Daily SMA200 | 0.6224 |
The previous day high was 0.6219 while the previous day low was 0.6131. The daily 38.2% Fib levels comes at 0.6165, expected to provide resistance. Similarly, the daily 61.8% fib level is at 0.6186, expected to provide resistance.
Note the levels of interest below:
- Pivot support is noted at 0.6114, 0.6078, 0.6026
- Pivot resistance is noted at 0.6202, 0.6255, 0.6291
| Levels | Levels.1 |
|---|---|
| Previous Daily High | 0.6219 |
| Previous Daily Low | 0.6131 |
| Previous Weekly High | 0.6274 |
| Previous Weekly Low | 0.6120 |
| Previous Monthly High | 0.6413 |
| Previous Monthly Low | 0.6120 |
| Daily Fibonacci 38.2% | 0.6165 |
| Daily Fibonacci 61.8% | 0.6186 |
| Daily Pivot Point S1 | 0.6114 |
| Daily Pivot Point S2 | 0.6078 |
| Daily Pivot Point S3 | 0.6026 |
| Daily Pivot Point R1 | 0.6202 |
| Daily Pivot Point R2 | 0.6255 |
| Daily Pivot Point R3 | 0.6291 |
[/s2If]
Download Nehcap EAWe have two EAs that are operational on our LIVE accounts.
- EA-FIX: Check out the details here. Download EA-FIX . EA-FIX is a non-grid HFT scalper.
- EA-GROWTH: High quality low dd EA using trend grids. Download EA_GROWTHJoin Our Telegram Group
")


