The GBPUSD currency pair has fallen below the lower boundary of an ascending channel and the 50-day Exponential Moving Average (EMA) at a level of 1.2742. It is currently trading at 1.2715 with a slight inclination towards a neutral to downward direction.
…
This is a premium post.
[s2If !current_user_can(access_s2member_level4)]Please register for FREE REGISTER to read full post below containing analysis. In case of any error or you think you are not able to read the full post below, please email us at support#nehcap.com [lwa][/s2If] [s2If current_user_can(access_s2member_level1)]
- GBP/USD breaks below the bottom of an ascending channel and the 50-day EMA at 1.2742, trading at 1.2715 with a neutral to downward bias.
The pair currently trades last at 1.27154.
The previous day high was 1.2841 while the previous day low was 1.2741. The daily 38.2% Fib levels comes at 1.278, expected to provide resistance. Similarly, the daily 61.8% fib level is at 1.2803, expected to provide resistance.
GBP/USD breaks below the bottom of an ascending channel, ahead of the Bank of Englan’s (BoE) monetary policy decision on Thursday, as the pair aims toward the 1.2700 psychological figure. As the Asian session commences, the GBP/USD is exchanging hands at 1.2715, posting minuscule gains of 0.04%.
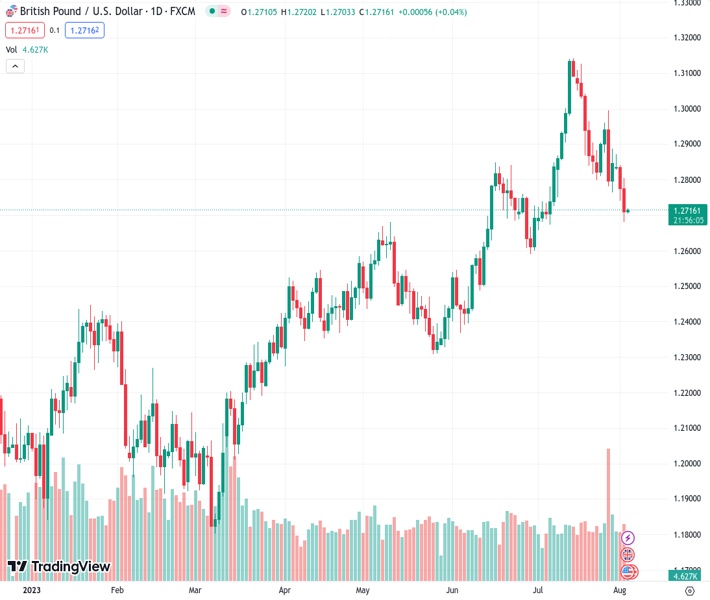
The GBP/USD is neutral to downward biased, as the daily chart depicts, as the pair dropped on Wednesday’s session below the 50-day Exponential Moving Average (EMA) at 1.2742. In addition, the GBP/USD extended its fall below the bottom of the ascending channel, opening the door for further losses. That, alongside the Relative Strength Index (RSI) indicator turning bearish, could pave the way for a drop below 1.2700. Nevertheless, the three-day Rate of Change (RoC) portrays a slight divergence with price action, suggesting that the 1.2700 psychological level might hold in the near term.
If GBP/USD drops below 1.2700, next support emerges at the 100-day EMA at 1.2591, followed by the 200-day EMA at 1.2440. Conversely, if GBP/USD stays above 1.2700 and reclaims the 50-day EMA at 1.2742, that could exacerbate a rally towards 1.2800 and beyond. Next resistance emerges at the 20-day EMA at 1.2827, followed by a downslope resistance trendline at 1.2925/40.
GBP/USD Price Action – Daily chart
Technical Levels: Supports and Resistances
GBPUSD currently trading at 1.2716 at the time of writing. Pair opened at 1.2776 and is trading with a change of -0.47 % .
| Overview | Overview.1 | |
|---|---|---|
| 0 | Today last price | 1.2716 |
| 1 | Today Daily Change | -0.0060 |
| 2 | Today Daily Change % | -0.4700 |
| 3 | Today daily open | 1.2776 |
The pair is trading below its 20 Daily moving average @ 1.29, above its 50 Daily moving average @ 1.2713 , above its 100 Daily moving average @ 1.2567 and above its 200 Daily moving average @ 1.23
| Trends | Trends.1 | |
|---|---|---|
| 0 | Daily SMA20 | 1.2900 |
| 1 | Daily SMA50 | 1.2713 |
| 2 | Daily SMA100 | 1.2567 |
| 3 | Daily SMA200 | 1.2300 |
The previous day high was 1.2841 while the previous day low was 1.2741. The daily 38.2% Fib levels comes at 1.278, expected to provide resistance. Similarly, the daily 61.8% fib level is at 1.2803, expected to provide resistance.
Note the levels of interest below:
- Pivot support is noted at 1.2731, 1.2686, 1.2631
- Pivot resistance is noted at 1.2832, 1.2887, 1.2932
| Levels | Levels.1 |
|---|---|
| Previous Daily High | 1.2841 |
| Previous Daily Low | 1.2741 |
| Previous Weekly High | 1.2996 |
| Previous Weekly Low | 1.2763 |
| Previous Monthly High | 1.3142 |
| Previous Monthly Low | 1.2659 |
| Daily Fibonacci 38.2% | 1.2780 |
| Daily Fibonacci 61.8% | 1.2803 |
| Daily Pivot Point S1 | 1.2731 |
| Daily Pivot Point S2 | 1.2686 |
| Daily Pivot Point S3 | 1.2631 |
| Daily Pivot Point R1 | 1.2832 |
| Daily Pivot Point R2 | 1.2887 |
| Daily Pivot Point R3 | 1.2932 |
[/s2If]
Download Nehcap EAWe have two EAs that are operational on our LIVE accounts.
- EA-FIX: Check out the details here. Download EA-FIX . EA-FIX is a non-grid HFT scalper.
- EA-GROWTH: High quality low dd EA using trend grids. Download EA_GROWTHJoin Our Telegram Group
")


