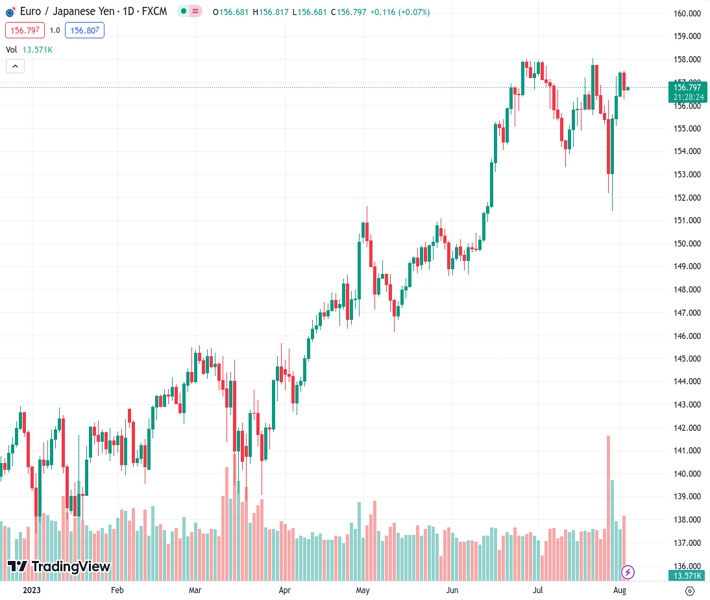
The EURJPY currency pair, currently at 156.783, has corrected from its highest point of the week at 157.50. It has dropped below 157.00 and is currently being traded at 156.78. It has not been able to reach the highest point of the year so far, which is 157.99.
…
This is a premium post.
[s2If !current_user_can(access_s2member_level4)]Please register for FREE REGISTER to read full post below containing analysis. In case of any error or you think you are not able to read the full post below, please email us at support#nehcap.com [lwa][/s2If] [s2If current_user_can(access_s2member_level1)]
- EUR/JPY retraces from the weekly high of 157.50, falling past 157.00, trading at 156.78, failing to test the YTD high of 157.99.
The pair currently trades last at 156.783.
The previous day high was 157.49 while the previous day low was 156.39. The daily 38.2% Fib levels comes at 157.07, expected to provide resistance. Similarly, the daily 61.8% fib level is at 156.81, expected to provide resistance.
EUR/JPY retraces from weekly highs of 157.50 and drops below 157.00 as buyers failed to extend their gains and test the year-to-date (YTD) high of 157.99. The reasons behind the Japanese Yen (JPY) strength are the Yield Curve Control (YCC) flexibility imposed by the Bank of Japan (BoJ), as well as the downgrade of US creditworthiness from AAA to AA+. Therefore, the EUR/JPY tumbled and is trading at 156.78.
The EUR/JPY appears to have peaked at around the 156.80/157.40 area, as depicted in the daily chart. The cross-currency pair has failed to decisively clear the 158.00 mark, exacerbating its fall beneath the 157.00 figure. In addition, a two-day candlestick called dark cloud cover looms, but Thursday’s price action must clear Wednesday’s daily low of 156.25 and achieve a daily close below the latter to extend its losses.
Notably, the Tenkan-Sen sits below the Kijun-Sen, at around the top of the Ichimoku Cloud (Kumo) at around 154.59/72, a bearish signal. Furthermore, the Chikou Span is positioned below the price action, suggesting that sellers could regain control in the near term.
The EUR/JPY first support would be 156.25, followed by the figure at 156.00. A breach of the latter will expose the Kijun-Sen at 154.72, followed by the Tenkan-Sen at 154.59, before dipping inside the Kumo. Conversely, if EUR/JPY reclaims 157.00, that could open the door for further upside, with buyers challenging 158.00.
Technical Levels: Supports and Resistances
EURJPY currently trading at 156.75 at the time of writing. Pair opened at 157.46 and is trading with a change of -0.45 % .
| Overview | Overview.1 | |
|---|---|---|
| 0 | Today last price | 156.75 |
| 1 | Today Daily Change | -0.71 |
| 2 | Today Daily Change % | -0.45 |
| 3 | Today daily open | 157.46 |
The pair remains strongly bullish on the daily timeframe. It trades above its 20 SMA @ 155.84, 50 SMA 154.15, 100 SMA @ 150.12 and 200 SMA @ 146.57.
| Trends | Trends.1 | |
|---|---|---|
| 0 | Daily SMA20 | 155.84 |
| 1 | Daily SMA50 | 154.15 |
| 2 | Daily SMA100 | 150.12 |
| 3 | Daily SMA200 | 146.57 |
The previous day high was 157.49 while the previous day low was 156.39. The daily 38.2% Fib levels comes at 157.07, expected to provide resistance. Similarly, the daily 61.8% fib level is at 156.81, expected to provide resistance.
Note the levels of interest below:
- Pivot support is noted at 156.74, 156.02, 155.64
- Pivot resistance is noted at 157.83, 158.21, 158.93
| Levels | Levels.1 |
|---|---|
| Previous Daily High | 157.49 |
| Previous Daily Low | 156.39 |
| Previous Weekly High | 157.80 |
| Previous Weekly Low | 151.41 |
| Previous Monthly High | 158.05 |
| Previous Monthly Low | 151.41 |
| Daily Fibonacci 38.2% | 157.07 |
| Daily Fibonacci 61.8% | 156.81 |
| Daily Pivot Point S1 | 156.74 |
| Daily Pivot Point S2 | 156.02 |
| Daily Pivot Point S3 | 155.64 |
| Daily Pivot Point R1 | 157.83 |
| Daily Pivot Point R2 | 158.21 |
| Daily Pivot Point R3 | 158.93 |
[/s2If]
Download Nehcap EAWe have two EAs that are operational on our LIVE accounts.
- EA-FIX: Check out the details here. Download EA-FIX . EA-FIX is a non-grid HFT scalper.
- EA-GROWTH: High quality low dd EA using trend grids. Download EA_GROWTHJoin Our Telegram Group
")


