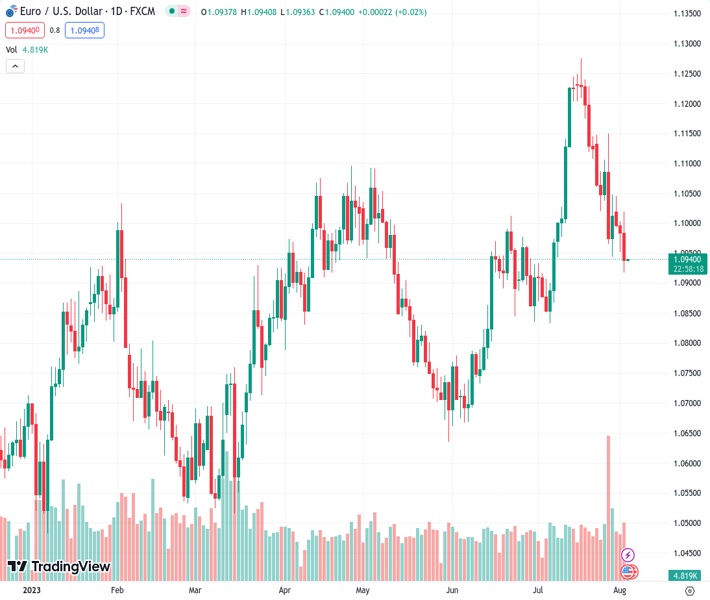
The EUR/USD currency pair experienced its third consecutive daily decline and dropped to the 1.09370 level.
…
This is a premium post.
[s2If !current_user_can(access_s2member_level4)]Please register for FREE REGISTER to read full post below containing analysis. In case of any error or you think you are not able to read the full post below, please email us at support#nehcap.com [lwa][/s2If] [s2If current_user_can(access_s2member_level1)]
- EUR/USD tallies a third stright daily loss, and fell to the 1.09370 level.
The pair currently trades last at 1.09390.
The previous day high was 1.1003 while the previous day low was 1.0952. The daily 38.2% Fib levels comes at 1.0972, expected to provide resistance. Similarly, the daily 61.8% fib level is at 1.0984, expected to provide resistance.
The EUR/USD is trading in negative territory after 3 consecutive days of losses, fueled by a stronger USD following robust labour market data. The greenback, measured by the DXY index, gained ground in the middle of the week and jumped to its highest label since July 7.
According to, Automatic Data Processing (ADP), Inc released the US Employment Change for July, which measures the change in the number of employed people in the US, came in at 324k, better than the expected 189k but below the previous 455k. With this in mind, hot labour market data may set the tone for the Federal Reserve (Fed) to consider one additional hike in 2023, and that is what is driving the USD upwards.
That being said, Jobless Claims on Thursday and the Nonfarm Payrolls report on Friday will give additional clues to the markets regarding the labour situation in the US and will continue placing their bets for the next Fed meeting. As for now, according to the CME FedWatch tool, the most likely case is that the Federal Open Market Committee (FOMC) won’t hike in September or November.
For the Eurozone’s side, Spain released the Unemployment Change for July, which showed that the number of unemployed workers added during the previous month, came in better than expected. This comes after Germany also reported strong labour figures on Tuesday. Its worth noting that Christine Lagarde highlighted that the labour market remains robust and also mentioned that incoming data will be considered for the following interest rate decisions, so strong data may fuel hawkish bets on the European Central Bank (ECB). For the rest of the week, Services PMIs from European countries will be released on Thursday, giving further guidance to both markets and the ECB regarding the economic activity situation in the zone.
According to the daily chart, bears are gaining ground as the Relative Strength Index (RSI) is in negative territory and has a slope below its midline. The Moving Average Convergence Divergence (MACD) prints strong growing red bars indicating that bulls are not in the scene.
Resistance levels: 1.0950, 1.1000, 1.1075 (20-day SMA).
Support levels: 1.0913 (100-day SMA), 1.0900, 1.0850.
Technical Levels: Supports and Resistances
EURUSD currently trading at 1.0938 at the time of writing. Pair opened at 1.0985 and is trading with a change of -0.43 % .
| Overview | Overview.1 | |
|---|---|---|
| 0 | Today last price | 1.0938 |
| 1 | Today Daily Change | -0.0047 |
| 2 | Today Daily Change % | -0.4300 |
| 3 | Today daily open | 1.0985 |
The pair is trading below its 20 Daily moving average @ 1.107, above its 50 Daily moving average @ 1.0923 , above its 100 Daily moving average @ 1.091 and above its 200 Daily moving average @ 1.073
| Trends | Trends.1 | |
|---|---|---|
| 0 | Daily SMA20 | 1.1070 |
| 1 | Daily SMA50 | 1.0923 |
| 2 | Daily SMA100 | 1.0910 |
| 3 | Daily SMA200 | 1.0730 |
The previous day high was 1.1003 while the previous day low was 1.0952. The daily 38.2% Fib levels comes at 1.0972, expected to provide resistance. Similarly, the daily 61.8% fib level is at 1.0984, expected to provide resistance.
Note the levels of interest below:
- Pivot support is noted at 1.0957, 1.0929, 1.0906
- Pivot resistance is noted at 1.1008, 1.1031, 1.1058
| Levels | Levels.1 |
|---|---|
| Previous Daily High | 1.1003 |
| Previous Daily Low | 1.0952 |
| Previous Weekly High | 1.1150 |
| Previous Weekly Low | 1.0944 |
| Previous Monthly High | 1.1276 |
| Previous Monthly Low | 1.0834 |
| Daily Fibonacci 38.2% | 1.0972 |
| Daily Fibonacci 61.8% | 1.0984 |
| Daily Pivot Point S1 | 1.0957 |
| Daily Pivot Point S2 | 1.0929 |
| Daily Pivot Point S3 | 1.0906 |
| Daily Pivot Point R1 | 1.1008 |
| Daily Pivot Point R2 | 1.1031 |
| Daily Pivot Point R3 | 1.1058 |
[/s2If]
Download Nehcap EAWe have two EAs that are operational on our LIVE accounts.
- EA-FIX: Check out the details here. Download EA-FIX . EA-FIX is a non-grid HFT scalper.
- EA-GROWTH: High quality low dd EA using trend grids. Download EA_GROWTHJoin Our Telegram Group
")


