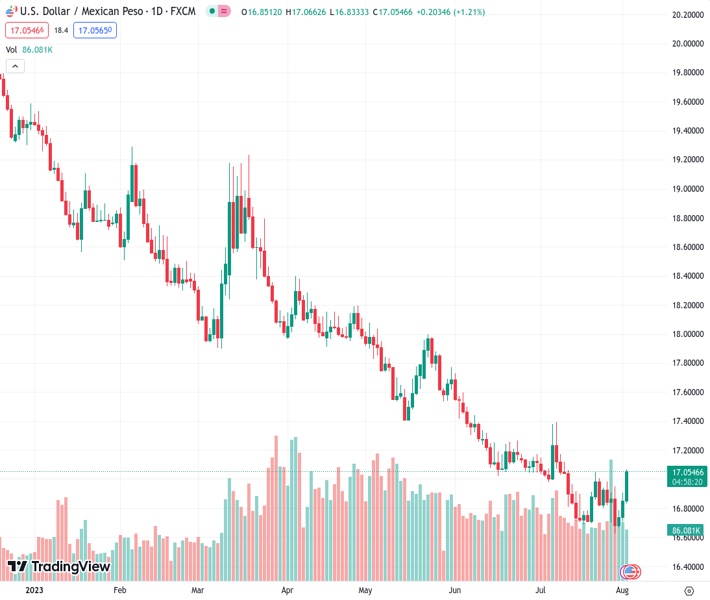
The currency pair US dollar to Mexican peso is currently being traded at a rate of 17.0378, which is higher than its lowest point of the day at 16.8333. Additionally, it is also trading above its 20-day Exponential Moving Average.
…
This is a premium post.
[s2If !current_user_can(access_s2member_level4)]Please register for FREE REGISTER to read full post below containing analysis. In case of any error or you think you are not able to read the full post below, please email us at support#nehcap.com [lwa][/s2If] [s2If current_user_can(access_s2member_level1)]
- USD/MXN pair is trading at 17.0378, up from its daily low of 16.8333 and above its 20-day Exponential Moving Average (EMA).
The pair currently trades last at 17.0468.
The previous day high was 16.9088 while the previous day low was 16.738. The daily 38.2% Fib levels comes at 16.8435, expected to provide support. Similarly, the daily 61.8% fib level is at 16.8033, expected to provide support.
The Mexican Peso (MXN) weakens as the North American session progresses, down 0.82%, as the USD/MXN exchange rate looms around 17.0000 with strength for the first time since July 21, 2023. The USD/MXN is trading at 17.0378, above its 20-day Exponential Moving Average (EMA), bouncing from a daily low of 16.8333.
A recent downgrade of debt issued by the United States (US) turned market sentiment sour as Wall Street trades with losses. Private hiring in the US rose by 324K, according to figures published by the ADP Research Institute in collaboration with Stanford Digital Economy Lab, exceeding estimates of 189K. Although the data is encouraging, it hasn’t been a prelude to the Nonfarm Payrolls report, which is expected on Friday, to show the economy added just 200K people to the workforce in July.
Regarding Tuesday’s data, the ISM Manufacturing PMI came at recessionary territory below the 50 figure for the ninth straight month, though it continued to improve; compared to June’s 46, it arrived at 46.4. Even though it was an improvement, the trend appears to slow down.
The USD/MXN resumed its uptrend based on the data bolstering the US Dollar (USD) as shown by the US Dollar Index (DXY). The DXY, which tracks the greenback’s performance against a basket of peers, stands at 102.663, gaining 0.69%, underpinned by US Treasury bond yields advance.
On the Mexican front, the Bank of Mexico (Banxico) Deputy Governor Jonathan Heath said, “restrictive monetary policy stance should be held for awhile to wait of it to have effect,” expressed in a Banorte podcast interview. He acknowledged that core inflation is not easing as the headline, adding that “it’s important for the exchange rate to be as flexible as possible with no intervention to manipulate it to a rate where it shouldn’t be.” He added that interest rates are “correct” even if the Fed hikes again.
From a technical standpoint, the USD/MXN downtrend remains intact but subject to a correction, as the 20-day EMA at 16.9005 has been left behind, with the exchange rate eyeing higher prices. The USD/MXN would face solid resistance at a three-month-old downslope resistance trendline nearby the 17.00 mark, below the 50-day EMA at 17.1336. Once that area is cleared, the USD/MXN could challenge a crucial resistance area at a May 17 low of 17.4038, which, once cleared, the 100-day EMA at 17.5313 would be up for grabs. On the downside, if USD/MXN drops below 16.9011, the year-to-date (YTD) low at 16.6238 could be tested.
Technical Levels: Supports and Resistances
USDMXN currently trading at 17.0224 at the time of writing. Pair opened at 16.879 and is trading with a change of 0.85 % .
| Overview | Overview.1 | |
|---|---|---|
| 0 | Today last price | 17.0224 |
| 1 | Today Daily Change | 0.1434 |
| 2 | Today Daily Change % | 0.8500 |
| 3 | Today daily open | 16.8790 |
The pair is trading above its 20 Daily moving average @ 16.8923, below its 50 Daily moving average @ 17.1461 , below its 100 Daily moving average @ 17.6115 and below its 200 Daily moving average @ 18.3559
| Trends | Trends.1 | |
|---|---|---|
| 0 | Daily SMA20 | 16.8923 |
| 1 | Daily SMA50 | 17.1461 |
| 2 | Daily SMA100 | 17.6115 |
| 3 | Daily SMA200 | 18.3559 |
The previous day high was 16.9088 while the previous day low was 16.738. The daily 38.2% Fib levels comes at 16.8435, expected to provide support. Similarly, the daily 61.8% fib level is at 16.8033, expected to provide support.
Note the levels of interest below:
- Pivot support is noted at 16.7751, 16.6712, 16.6044
- Pivot resistance is noted at 16.9458, 17.0126, 17.1165
| Levels | Levels.1 |
|---|---|
| Previous Daily High | 16.9088 |
| Previous Daily Low | 16.7380 |
| Previous Weekly High | 17.0097 |
| Previous Weekly Low | 16.6258 |
| Previous Monthly High | 17.3957 |
| Previous Monthly Low | 16.6258 |
| Daily Fibonacci 38.2% | 16.8435 |
| Daily Fibonacci 61.8% | 16.8033 |
| Daily Pivot Point S1 | 16.7751 |
| Daily Pivot Point S2 | 16.6712 |
| Daily Pivot Point S3 | 16.6044 |
| Daily Pivot Point R1 | 16.9458 |
| Daily Pivot Point R2 | 17.0126 |
| Daily Pivot Point R3 | 17.1165 |
[/s2If]
Download Nehcap EAWe have two EAs that are operational on our LIVE accounts.
- EA-FIX: Check out the details here. Download EA-FIX . EA-FIX is a non-grid HFT scalper.
- EA-GROWTH: High quality low dd EA using trend grids. Download EA_GROWTHJoin Our Telegram Group
")


