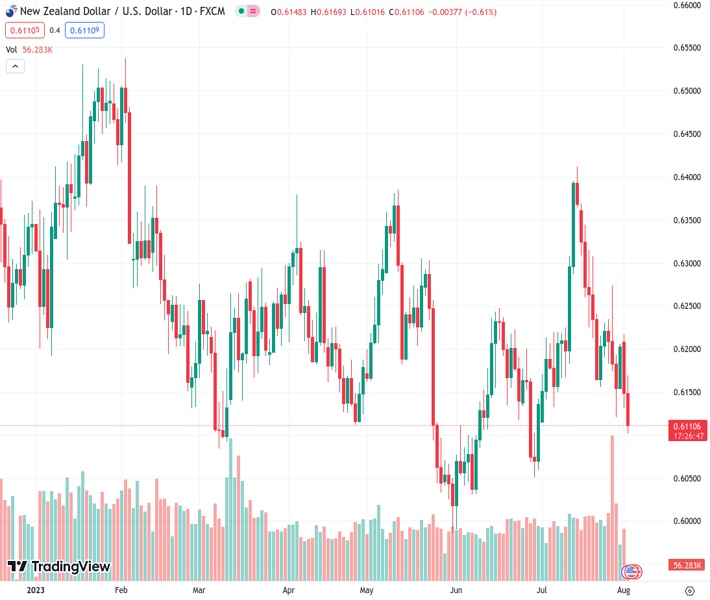
The currency pair NZDUSD, currently at 0.61097, continues its downward trend for the second consecutive day, reaching its lowest point in almost a month.
…
This is a premium post.
[s2If !current_user_can(access_s2member_level4)]Please register for FREE REGISTER to read full post below containing analysis. In case of any error or you think you are not able to read the full post below, please email us at support#nehcap.com [lwa][/s2If] [s2If current_user_can(access_s2member_level1)]
- NZD/USD turns lower for the second straight day and drops to a nearly one-month low.
The pair currently trades last at 0.61097.
The previous day high was 0.6219 while the previous day low was 0.6131. The daily 38.2% Fib levels comes at 0.6165, expected to provide resistance. Similarly, the daily 61.8% fib level is at 0.6186, expected to provide resistance.
The NZD/USD pair attracts fresh sellers following an Asian session uptick to the 0.6175 region and drifts into negative territory for the second successive day on Wednesday. Spot prices drop to over a one-month low in the last hour and currently trade just above the 0.6100 round-figure mark, down 0.75% for the day.
The New Zealand Dollar (NZD) weakens in reaction to the mixed domestic employment details, which showed that the jobless rate climbed to 3.6% during the second quarter and offset a larger-than-anticipated rise in the number of employed people. Adding to this, the Labour Cost Index also falls short of market expectations and pushes back against bets for further rate hikes by the Reserve Bank of New Zealand (RBNZ).
Apart from this, a softer risk tone assists the safe-haven US Dollar (USD) to reverse its modest intraday losses and turns out to be another factor driving flows away from the risk-sensitive Kiwi. Despite the fact that Fitch downgraded the US government’s credit rating to AA+ from AAA, rising bets for one more 25 bps rate hike by the Federal Reserve (Fed) act as a tailwind for the Greenback and further weigh on the NZD/USD pair.
From a technical perspective, spot prices have now slipped below support marked by an upward sloping trend-line extending from the YTD low touched on May 31. Moreover, oscillators on the daily chart have again started gaining negative traction and support prospects for an extension of a nearly three-week-old downtrend. That said, bearish traders might still wait for a break below the 0.6100 mark before placing fresh bets.
The NZD/USD pair might then accelerate the fall towards testing the next relevant support near the 0.6065-0.6055 region before eventually dropping to the 0.6000 psychological mark. This is closely followed by the YTD low, around the 0.5985 region, which if broken decisively will set the stage for a further near-term depreciating move.
On the flip side, the immediate hurdle is pegged near the 0.6150 region ahead of the daily swing high, around the 0.6165-0.6170 area. Any subsequent move up is likely to attract fresh sellers near the 0.6200 round-figure mark and remain capped near a technically significant 200-day Simple Moving Average (SMA), around the 0.6225 zone. A sustained strength beyond might shift the bias in favour of bulls and trigger a short-covering rally.
Technical Levels: Supports and Resistances
NZDUSD currently trading at 0.6121 at the time of writing. Pair opened at 0.615 and is trading with a change of -0.47 % .
| Overview | Overview.1 | |
|---|---|---|
| 0 | Today last price | 0.6121 |
| 1 | Today Daily Change | -0.0029 |
| 2 | Today Daily Change % | -0.4700 |
| 3 | Today daily open | 0.6150 |
The pair remains strongly bearish on the daily time frame. It trades below the 20 SMA @ 0.623, 50 SMA 0.6164, 100 SMA @ 0.6197 and 200 SMA @ 0.6224.
| Trends | Trends.1 | |
|---|---|---|
| 0 | Daily SMA20 | 0.6230 |
| 1 | Daily SMA50 | 0.6164 |
| 2 | Daily SMA100 | 0.6197 |
| 3 | Daily SMA200 | 0.6224 |
The previous day high was 0.6219 while the previous day low was 0.6131. The daily 38.2% Fib levels comes at 0.6165, expected to provide resistance. Similarly, the daily 61.8% fib level is at 0.6186, expected to provide resistance.
Note the levels of interest below:
- Pivot support is noted at 0.6114, 0.6078, 0.6026
- Pivot resistance is noted at 0.6202, 0.6255, 0.6291
| Levels | Levels.1 |
|---|---|
| Previous Daily High | 0.6219 |
| Previous Daily Low | 0.6131 |
| Previous Weekly High | 0.6274 |
| Previous Weekly Low | 0.6120 |
| Previous Monthly High | 0.6413 |
| Previous Monthly Low | 0.6120 |
| Daily Fibonacci 38.2% | 0.6165 |
| Daily Fibonacci 61.8% | 0.6186 |
| Daily Pivot Point S1 | 0.6114 |
| Daily Pivot Point S2 | 0.6078 |
| Daily Pivot Point S3 | 0.6026 |
| Daily Pivot Point R1 | 0.6202 |
| Daily Pivot Point R2 | 0.6255 |
| Daily Pivot Point R3 | 0.6291 |
[/s2If]
Download Nehcap EAWe have two EAs that are operational on our LIVE accounts.
- EA-FIX: Check out the details here. Download EA-FIX . EA-FIX is a non-grid HFT scalper.
- EA-GROWTH: High quality low dd EA using trend grids. Download EA_GROWTHJoin Our Telegram Group
")


