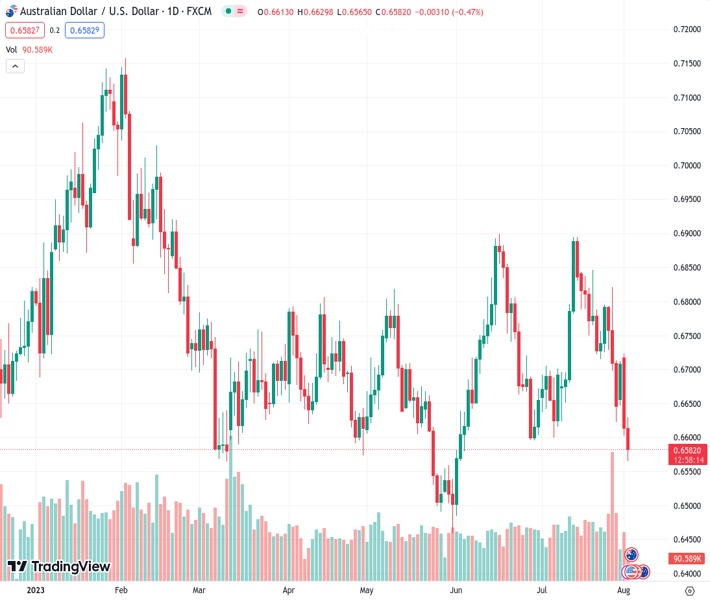
The AUDUSD pair, currently at a level of 0.65804, is experiencing a continuous decline for the second consecutive day, resulting in a drop to its lowest point in almost two months.
…
This is a premium post.
[s2If !current_user_can(access_s2member_level4)]Please register for FREE REGISTER to read full post below containing analysis. In case of any error or you think you are not able to read the full post below, please email us at support#nehcap.com [lwa][/s2If] [s2If current_user_can(access_s2member_level1)]
- AUD/USD drifts lower for the second straight day and drops to a nearly two-month low.
The pair currently trades last at 0.65804.
The previous day high was 0.6724 while the previous day low was 0.6602. The daily 38.2% Fib levels comes at 0.6649, expected to provide resistance. Similarly, the daily 61.8% fib level is at 0.6677, expected to provide resistance.
The AUD/USD pair remains under some selling pressure for the second successive day on Wednesday and continues losing ground through the early European session. Spot prices drop to a near two-month low, around the 0.6575 region in the last hour, and seem vulnerable to prolonging the recent downward trajectory witnessed over the past three weeks or so.
The global risk sentiment takes a hit after Fitch unexpectedly downgraded the US Long-Term Foreign-Currency Issuer Default Rating (IDR) to ‘AA+’ from ‘AAA’, citing fiscal deterioration over the next three years. This, along with China’s economic woes and the Reserve Bank of Australia’s (RBA) surprise decision to leave the Official Cash Rate (OCR) unchanged for the second straight meeting, weighs heavily on the Australian Dollar (AUD). Even a modest US Dollar (USD) weakness fails to impress bulls or lend any support to the AUD/USD pair.
The global flight to safety triggers a modest decline in the US Treasury bond yields and fails to assist the buck to capitalize on a two-week-old uptrend to its highest level since July 10 touched on Tuesday. In fact, the USD Index (DXY), which tracks the Greenback against a basket of currencies, so far, has struggled to make it through a technically significant 100-day Simple Moving Average (SMA) barrier. That said, rising bets for further policy tightening by the Federal Reserve (Fed) continue to act as a tailwind and help limit the intraday dip.
It is worth recalling that Fed Chair Jerome Powell had said that the economy still needs to slow and the labour market to weaken for inflation to credibly return to the 2% target. Moreover, the incoming US macro data points to an extremely resilient economy and keeps the door for another 25 bps lift-off in September or November wide open. This, along with a convincing break and acceptance below the 0.6600 round-figure mark, favours the AUD/USD bears and suggests that the path of least resistance for spot prices remains to the downside.
Market participants now look forward to the US ADP report on private-sector employment, due for release later during the early North American session. Apart from this, the US bond yields will influence the USD price dynamics and provide a fresh impetus to the AUD/USD pair. Traders will further take cues from the broader risk sentiment to grab short-term opportunities around the risk-sensitive Aussie. The focus, however, remains glued to the release of the crucial US monthly employment details, popularly known as the NFP report on Friday.
Technical Levels: Supports and Resistances
AUDUSD currently trading at 0.658 at the time of writing. Pair opened at 0.6613 and is trading with a change of -0.5 % .
| Overview | Overview.1 | |
|---|---|---|
| 0 | Today last price | 0.6580 |
| 1 | Today Daily Change | -0.0033 |
| 2 | Today Daily Change % | -0.5000 |
| 3 | Today daily open | 0.6613 |
The pair remains strongly bearish on the daily time frame. It trades below the 20 SMA @ 0.6737, 50 SMA 0.67, 100 SMA @ 0.6692 and 200 SMA @ 0.6732.
| Trends | Trends.1 | |
|---|---|---|
| 0 | Daily SMA20 | 0.6737 |
| 1 | Daily SMA50 | 0.6700 |
| 2 | Daily SMA100 | 0.6692 |
| 3 | Daily SMA200 | 0.6732 |
The previous day high was 0.6724 while the previous day low was 0.6602. The daily 38.2% Fib levels comes at 0.6649, expected to provide resistance. Similarly, the daily 61.8% fib level is at 0.6677, expected to provide resistance.
Note the levels of interest below:
- Pivot support is noted at 0.6569, 0.6525, 0.6448
- Pivot resistance is noted at 0.669, 0.6768, 0.6812
| Levels | Levels.1 |
|---|---|
| Previous Daily High | 0.6724 |
| Previous Daily Low | 0.6602 |
| Previous Weekly High | 0.6821 |
| Previous Weekly Low | 0.6623 |
| Previous Monthly High | 0.6895 |
| Previous Monthly Low | 0.6599 |
| Daily Fibonacci 38.2% | 0.6649 |
| Daily Fibonacci 61.8% | 0.6677 |
| Daily Pivot Point S1 | 0.6569 |
| Daily Pivot Point S2 | 0.6525 |
| Daily Pivot Point S3 | 0.6448 |
| Daily Pivot Point R1 | 0.6690 |
| Daily Pivot Point R2 | 0.6768 |
| Daily Pivot Point R3 | 0.6812 |
[/s2If]
Download Nehcap EAWe have two EAs that are operational on our LIVE accounts.
- EA-FIX: Check out the details here. Download EA-FIX . EA-FIX is a non-grid HFT scalper.
- EA-GROWTH: High quality low dd EA using trend grids. Download EA_GROWTHJoin Our Telegram Group
")


