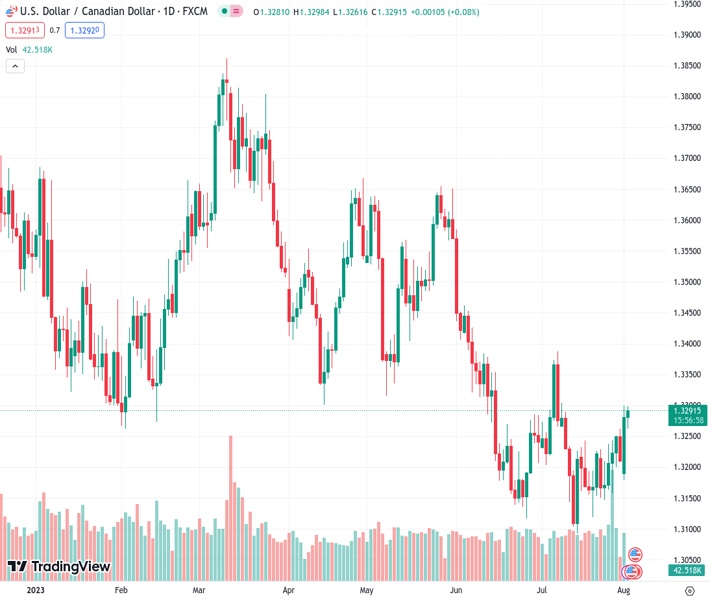
Some people are interested in purchasing USDCAD at a rate of 1.32935, causing the price to increase and move closer to the highest point it reached three weeks ago on Tuesday.
…
This is a premium post.
[s2If !current_user_can(access_s2member_level4)]Please register for FREE REGISTER to read full post below containing analysis. In case of any error or you think you are not able to read the full post below, please email us at support#nehcap.com [lwa][/s2If] [s2If current_user_can(access_s2member_level1)]
- USD/CAD attracts some dip-buying and climbs back closer to a three-week high set on Tuesday.
The pair currently trades last at 1.32935.
The previous day high was 1.33 while the previous day low was 1.3184. The daily 38.2% Fib levels comes at 1.3256, expected to provide support. Similarly, the daily 61.8% fib level is at 1.3229, expected to provide support.
The USD/CAD pair turns positive for the second straight day on Wednesday, following an Asian session dip to the 1.3260 area, and climbs back closer to over a three-week high touched the previous day. Bullish traders, however, might still wait for a sustained strength above the 1.3300 round-figure mark before positioning for any further appreciating move.
Despite the fact that Fitch downgraded the US government’s credit rating to AA+ from AAA, expectations for one more 25 bps rate hike by the Federal Reserve (Fed) act as a tailwind for the US Dollar (USD) and assist the USD/CAD pair to attract some dip-buying. In fact, Fed Chair Jerome Powell said last week that the economy still needs to slow and the labour market to weaken for inflation to credibly return to the 2% target. Moreover, the incoming US macro data points to an extremely resilient economy and supports prospects for further policy tightening by the Fed.
Apart from this, a slight deterioration in the global risk sentiment – as depicted by a generally weaker tone around the equity markets – further benefits the safe-haven Greenback. That said, the recent bullish run-up in Crude Oil prices to the highest level since April 17 underpins the commodity-linked Loonie and might hold back bulls from placing aggressive bets around the USD/CAD pair. A substantially larger-than-expected drawdown in US inventories over the past week helps offset demand concerns and continues to lend some support to the black liquid.
From a technical perspective, however, the overnight move and acceptance above the 1.3240-1.3245 supply zone suggest that the path of least resistance for the USD/CAD pair is to the upside. Some follow-through buying beyond the 50-day Simple Moving Average (SMA) will reaffirm the positive outlook and pave the way for further gains. Traders now look to the US ADP report on private-sector employment, due later during the early North American session. This, along with the broader risk sentiment, will drive the USD and provide some impetus to the major.
Apart from this, Oil price dynamics should allow traders to grab short-term opportunities. The focus, meanwhile, will remain glued to the monthly employment details from the US – popularly known as the NFP report – and Canada, due for release on Friday.
Technical Levels: Supports and Resistances
USDCAD currently trading at 1.3292 at the time of writing. Pair opened at 1.3282 and is trading with a change of 0.08 % .
| Overview | Overview.1 | |
|---|---|---|
| 0 | Today last price | 1.3292 |
| 1 | Today Daily Change | 0.0010 |
| 2 | Today Daily Change % | 0.0800 |
| 3 | Today daily open | 1.3282 |
The pair is trading above its 20 Daily moving average @ 1.3218, below its 50 Daily moving average @ 1.3295 , below its 100 Daily moving average @ 1.3414 and below its 200 Daily moving average @ 1.3459
| Trends | Trends.1 | |
|---|---|---|
| 0 | Daily SMA20 | 1.3218 |
| 1 | Daily SMA50 | 1.3295 |
| 2 | Daily SMA100 | 1.3414 |
| 3 | Daily SMA200 | 1.3459 |
The previous day high was 1.33 while the previous day low was 1.3184. The daily 38.2% Fib levels comes at 1.3256, expected to provide support. Similarly, the daily 61.8% fib level is at 1.3229, expected to provide support.
Note the levels of interest below:
- Pivot support is noted at 1.321, 1.314, 1.3095
- Pivot resistance is noted at 1.3326, 1.3371, 1.3442
| Levels | Levels.1 |
|---|---|
| Previous Daily High | 1.3300 |
| Previous Daily Low | 1.3184 |
| Previous Weekly High | 1.3255 |
| Previous Weekly Low | 1.3147 |
| Previous Monthly High | 1.3387 |
| Previous Monthly Low | 1.3093 |
| Daily Fibonacci 38.2% | 1.3256 |
| Daily Fibonacci 61.8% | 1.3229 |
| Daily Pivot Point S1 | 1.3210 |
| Daily Pivot Point S2 | 1.3140 |
| Daily Pivot Point S3 | 1.3095 |
| Daily Pivot Point R1 | 1.3326 |
| Daily Pivot Point R2 | 1.3371 |
| Daily Pivot Point R3 | 1.3442 |
[/s2If]
Download Nehcap EAWe have two EAs that are operational on our LIVE accounts.
- EA-FIX: Check out the details here. Download EA-FIX . EA-FIX is a non-grid HFT scalper.
- EA-GROWTH: High quality low dd EA using trend grids. Download EA_GROWTHJoin Our Telegram Group
")


