Silver is facing difficulty in maintaining small gains made during the day, but it is still above its lowest point of the week.
…
This is a premium post.
[s2If !current_user_can(access_s2member_level4)]Please register for FREE REGISTER to read full post below containing analysis. In case of any error or you think you are not able to read the full post below, please email us at support#nehcap.com [lwa][/s2If] [s2If current_user_can(access_s2member_level1)]
- Silver struggles to preserve modest intraday gains, though holds above the weekly low.
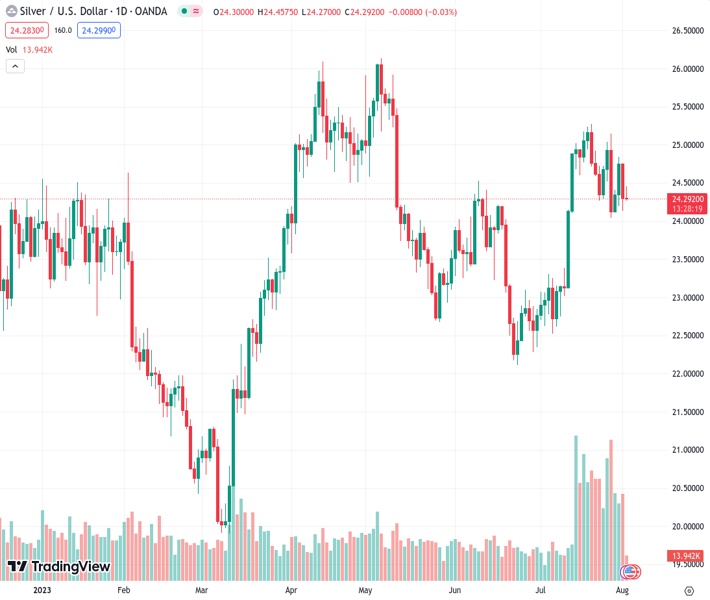
The pair currently trades last at 24.274.
The previous day high was 24.76 while the previous day low was 24.13. The daily 38.2% Fib levels comes at 24.37, expected to provide resistance. Similarly, the daily 61.8% fib level is at 24.52, expected to provide resistance.
Silver attracts fresh selling following an intraday uptick to the $24.45 region on Wednesday and touches a fresh daily trough during the early European session on Wednesday. The white metal currently trades around the $24.30-$24.25 region, nearly unchanged for the day, and manages to hold its neck above the weekly low touched on Tuesday.
Any subsequent fall is more likely to find support near last week’s swing low, around the $24.00 mark, which now coincides with a technically significant 100-day Simple Moving Average (SMA) and should act as a pivotal point. Meanwhile, oscillators on the daily chart – though have been losing traction – are yet to confirm a bearish outlook. This makes it prudent to wait for a sustained break below the said handle before positioning for any further depreciating move.
The XAG/USD might then accelerate the downward trajectory towards challenging the very important 200-day SMA, currently around the $23.15-$23.20 region. This is closely followed by the $23.00 round-figure mark, which if broken will expose the multi-month low, around the $22.15-$22.10 area touched in June.
On the flip side, the daily peak, around the $24.45 area, now seems to act as an immediate hurdle ahead of the $24.75 region, or the overnight swing high, and the $25.00 psychological mark. The next relevant hurdle is pegged near the monthly peak, around the $25.25 zone, which if cleared could lift the XAG/USD beyond the $25.50-$25.55 hurdle. Bulls might then aim to reclaim the $26.00 mark and retest the YTD peak, around the $26.10-$26.15 area touched in May.
Technical Levels: Supports and Resistances
XAGUSD currently trading at 24.3 at the time of writing. Pair opened at 24.3 and is trading with a change of 0.0 % .
| Overview | Overview.1 | |
|---|---|---|
| 0 | Today last price | 24.3 |
| 1 | Today Daily Change | 0.0 |
| 2 | Today Daily Change % | 0.0 |
| 3 | Today daily open | 24.3 |
The pair remains strongly bullish on the daily timeframe. It trades above its 20 SMA @ 24.25, 50 SMA 23.69, 100 SMA @ 23.99 and 200 SMA @ 23.11.
| Trends | Trends.1 | |
|---|---|---|
| 0 | Daily SMA20 | 24.25 |
| 1 | Daily SMA50 | 23.69 |
| 2 | Daily SMA100 | 23.99 |
| 3 | Daily SMA200 | 23.11 |
The previous day high was 24.76 while the previous day low was 24.13. The daily 38.2% Fib levels comes at 24.37, expected to provide resistance. Similarly, the daily 61.8% fib level is at 24.52, expected to provide resistance.
Note the levels of interest below:
- Pivot support is noted at 24.03, 23.76, 23.4
- Pivot resistance is noted at 24.67, 25.03, 25.3
| Levels | Levels.1 |
|---|---|
| Previous Daily High | 24.76 |
| Previous Daily Low | 24.13 |
| Previous Weekly High | 25.15 |
| Previous Weekly Low | 24.04 |
| Previous Monthly High | 25.27 |
| Previous Monthly Low | 22.52 |
| Daily Fibonacci 38.2% | 24.37 |
| Daily Fibonacci 61.8% | 24.52 |
| Daily Pivot Point S1 | 24.03 |
| Daily Pivot Point S2 | 23.76 |
| Daily Pivot Point S3 | 23.40 |
| Daily Pivot Point R1 | 24.67 |
| Daily Pivot Point R2 | 25.03 |
| Daily Pivot Point R3 | 25.30 |
[/s2If]
Download Nehcap EAWe have two EAs that are operational on our LIVE accounts.
- EA-FIX: Check out the details here. Download EA-FIX . EA-FIX is a non-grid HFT scalper.
- EA-GROWTH: High quality low dd EA using trend grids. Download EA_GROWTHJoin Our Telegram Group
")


