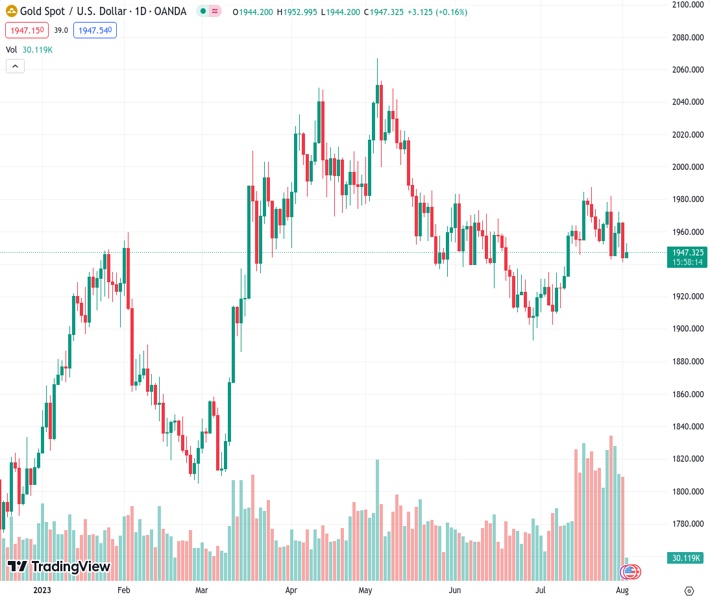
Gold price is experiencing small fluctuations below $1,950, increasing by 0.2% due to cautiousness in the market.
…
This is a premium post.
[s2If !current_user_can(access_s2member_level4)]Please register for FREE REGISTER to read full post below containing analysis. In case of any error or you think you are not able to read the full post below, please email us at support#nehcap.com [lwa][/s2If] [s2If current_user_can(access_s2member_level1)]
- Gold price oscillates in a narrow range below $1,950, gaining 0.2% as the market turns cautious.
The pair currently trades last at 1946.49.
The previous day high was 1966.08 while the previous day low was 1941.33. The daily 38.2% Fib levels comes at 1950.78, expected to provide resistance. Similarly, the daily 61.8% fib level is at 1956.63, expected to provide resistance.
The gold price consolidates in a narrow range between $1,945 and $1,952 during the Asian session on Wednesday. XAU/USD recovers some of the previous day’s drop to the $1,941 level.
Market sentiment remains sour as Fitch downgraded the US Long-Term Foreign-Currency Issuer Default Rating from AAA to AA+. The leading rating company cites an expected fiscal deterioration over the next three years and a high general government debt burden as the primary reasons for this drastic action.
US Treasury Secretary Janet Yellen expressed her strong disagreement with Fitch’s decision to downgrade the US government’s credit rating, calling it “arbitrary and based on outdated data”, according to Reuters. This headline fuels concern about the US debt ceiling crisis and might cap the upside in the Greenback. This, in turn, might benefit the price of gold, a traditional safe-haven asset.
Furthermore, the escalating tensions between the US-China might exert some pressure on the US Dollar. Chinese authorities announced on Monday restrictions on the export of certain drones and drone-related equipment to the United States, citing “national security and interests.” Notably, the United States is China’s largest export market for drones. Additionally, US President Joe Biden plans to sign an executive order curbing US technology investments in China by mid-August.
On the other hand, the odds of additional rate hikes by the Federal Reserve (Fed), the European Central Bank (ECB), and the Bank of England (BoE) may limit the US Dollar’s upside and act as a tailwind for the gold price. It’s worth noting that gold is sensitive to rising interest rates as they raise the opportunity cost of holding non-yielding bullion.
Market participants await the US ADP Employment Change due later in the American session. Also, the US weekly Jobless Claims and Unit Labour Cost will be released later this week. The highlight of the week will be the US Nonfarm Payrolls (NFP). The US economy is expected to have created 180,000 jobs. In the meantime, gold traders will closely monitor the headlines surrounding the US-China relationship for a clear direction in the gold price.
Technical Levels: Supports and Resistances
XAUUSD currently trading at 1947.3 at the time of writing. Pair opened at 1944.31 and is trading with a change of 0.15 % .
| Overview | Overview.1 | |
|---|---|---|
| 0 | Today last price | 1947.30 |
| 1 | Today Daily Change | 2.99 |
| 2 | Today Daily Change % | 0.15 |
| 3 | Today daily open | 1944.31 |
The pair is trading below its 20 Daily moving average @ 1951.54, above its 50 Daily moving average @ 1945.84 , below its 100 Daily moving average @ 1968.4 and above its 200 Daily moving average @ 1890.75
| Trends | Trends.1 | |
|---|---|---|
| 0 | Daily SMA20 | 1951.54 |
| 1 | Daily SMA50 | 1945.84 |
| 2 | Daily SMA100 | 1968.40 |
| 3 | Daily SMA200 | 1890.75 |
The previous day high was 1966.08 while the previous day low was 1941.33. The daily 38.2% Fib levels comes at 1950.78, expected to provide resistance. Similarly, the daily 61.8% fib level is at 1956.63, expected to provide resistance.
Note the levels of interest below:
- Pivot support is noted at 1935.07, 1925.82, 1910.32
- Pivot resistance is noted at 1959.82, 1975.32, 1984.57
| Levels | Levels.1 |
|---|---|
| Previous Daily High | 1966.08 |
| Previous Daily Low | 1941.33 |
| Previous Weekly High | 1982.20 |
| Previous Weekly Low | 1942.65 |
| Previous Monthly High | 1987.54 |
| Previous Monthly Low | 1902.77 |
| Daily Fibonacci 38.2% | 1950.78 |
| Daily Fibonacci 61.8% | 1956.63 |
| Daily Pivot Point S1 | 1935.07 |
| Daily Pivot Point S2 | 1925.82 |
| Daily Pivot Point S3 | 1910.32 |
| Daily Pivot Point R1 | 1959.82 |
| Daily Pivot Point R2 | 1975.32 |
| Daily Pivot Point R3 | 1984.57 |
[/s2If]
Download Nehcap EAWe have two EAs that are operational on our LIVE accounts.
- EA-FIX: Check out the details here. Download EA-FIX . EA-FIX is a non-grid HFT scalper.
- EA-GROWTH: High quality low dd EA using trend grids. Download EA_GROWTHJoin Our Telegram Group
")


