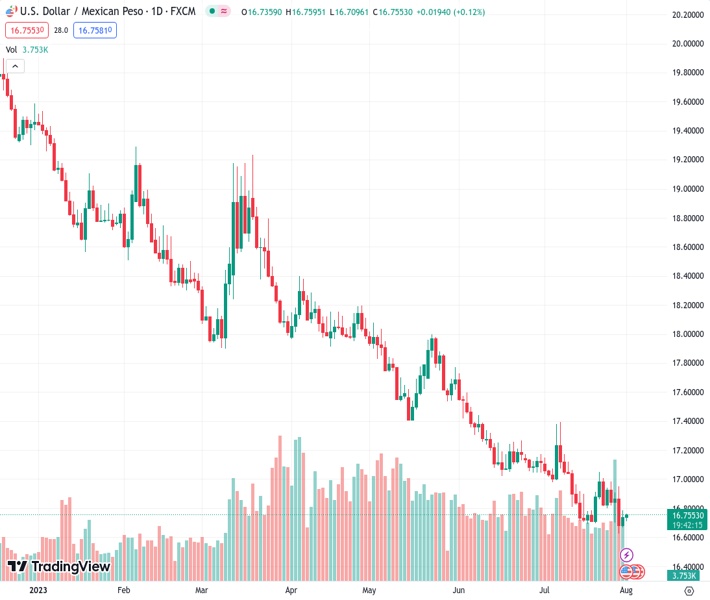
The USDMXN, currently at a rate of 16.7551, has successfully recovered from its lowest point in several years at the beginning of the week. However, it has remained stagnant recently and is not predicted to rise significantly in the near future, according to @nehcap.
…
This is a premium post.
[s2If !current_user_can(access_s2member_level4)]Please register for FREE REGISTER to read full post below containing analysis. In case of any error or you think you are not able to read the full post below, please email us at support#nehcap.com [lwa][/s2If] [s2If current_user_can(access_s2member_level1)]
- USD/MXN defends week-start rebound from multi-year low, sidelined of late.
The pair currently trades last at 16.7551.
The previous day high was 16.7886 while the previous day low was 16.6694. The daily 38.2% Fib levels comes at 16.743, expected to provide support. Similarly, the daily 61.8% fib level is at 16.7149, expected to provide support.
USD/MXN remains sidelined near 16.75 during Tuesday’s Asian session, after bouncing off the lowest levels since late 2015 the previous day.
In doing so, the Mexican Peso (MXN) pair justifies the week-start run-up beyond the two-week-old horizontal resistance, now support around 16.70. Adding strength to the stated 16.70 resistance-turned-support is an ascending trend line stretched from late Friday.
That said, the bullish MACD signals and the upbeat RSI (14) line, not overbought, keeps the USD/MXN pair buyers hopeful.
However, a convergence of the 200-Hour Simple Moving Average (HMA) and a downward-sloping trend line from July 21, close to 16.83 by the press time, appears a tough nut to crack for the USD/MXN bulls.
In a case where the Mexican Peso sellers manage to break the 16.83 hurdle, the odds of witnessing a run-up towards the 17.00 threshold and then to the previous monthly high of around 17.40 can’t be ruled out.
On the contrary, a downside break of the 16.70 support confluence could recall the USD/MXN sellers. Even so, the latest swing low of around 16.62 can prod the Mexican Peso buyers before directing them to the October 2015 low of near 16.32.
Trend: Limited upside expected
Technical Levels: Supports and Resistances
USDMXN currently trading at 16.7485 at the time of writing. Pair opened at 16.7421 and is trading with a change of 0.04% % .
| Overview | Overview.1 | |
|---|---|---|
| 0 | Today last price | 16.7485 |
| 1 | Today Daily Change | 0.0064 |
| 2 | Today Daily Change % | 0.04% |
| 3 | Today daily open | 16.7421 |
The pair remains strongly bearish on the daily time frame. It trades below the 20 SMA @ 16.9007, 50 SMA 17.168, 100 SMA @ 17.6287 and 200 SMA @ 18.3709.
| Trends | Trends.1 | |
|---|---|---|
| 0 | Daily SMA20 | 16.9007 |
| 1 | Daily SMA50 | 17.1680 |
| 2 | Daily SMA100 | 17.6287 |
| 3 | Daily SMA200 | 18.3709 |
The previous day high was 16.7886 while the previous day low was 16.6694. The daily 38.2% Fib levels comes at 16.743, expected to provide support. Similarly, the daily 61.8% fib level is at 16.7149, expected to provide support.
Note the levels of interest below:
- Pivot support is noted at 16.6781, 16.6142, 16.559
- Pivot resistance is noted at 16.7973, 16.8525, 16.9165
| Levels | Levels.1 |
|---|---|
| Previous Daily High | 16.7886 |
| Previous Daily Low | 16.6694 |
| Previous Weekly High | 17.0097 |
| Previous Weekly Low | 16.6258 |
| Previous Monthly High | 17.3957 |
| Previous Monthly Low | 16.6258 |
| Daily Fibonacci 38.2% | 16.7430 |
| Daily Fibonacci 61.8% | 16.7149 |
| Daily Pivot Point S1 | 16.6781 |
| Daily Pivot Point S2 | 16.6142 |
| Daily Pivot Point S3 | 16.5590 |
| Daily Pivot Point R1 | 16.7973 |
| Daily Pivot Point R2 | 16.8525 |
| Daily Pivot Point R3 | 16.9165 |
[/s2If]
Download Nehcap EAWe have two EAs that are operational on our LIVE accounts.
- EA-FIX: Check out the details here. Download EA-FIX . EA-FIX is a non-grid HFT scalper.
- EA-GROWTH: High quality low dd EA using trend grids. Download EA_GROWTHJoin Our Telegram Group
")


