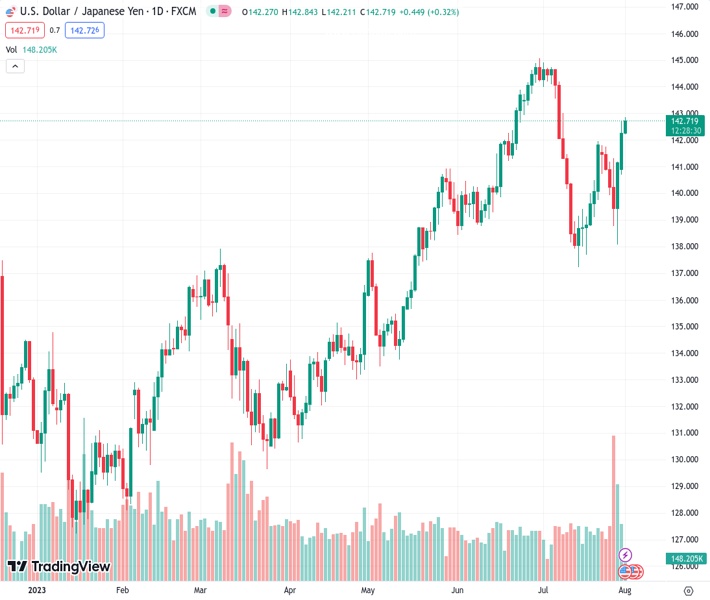
The USDJPY pair has been increasing for the third day in a row and has reached its highest point in three weeks.
…
This is a premium post.
[s2If !current_user_can(access_s2member_level4)]Please register for FREE REGISTER to read full post below containing analysis. In case of any error or you think you are not able to read the full post below, please email us at support#nehcap.com [lwa][/s2If] [s2If current_user_can(access_s2member_level1)]
- USD/JPY scales higher for the third successive day and climbs to a three-week high.
The pair currently trades last at 142.689.
The previous day high was 142.7 while the previous day low was 140.69. The daily 38.2% Fib levels comes at 141.93, expected to provide support. Similarly, the daily 61.8% fib level is at 141.46, expected to provide support.
The USD/JPY pair builds on last week’s solid bounce from the 138.00 neighbourhood and climbs to over a three-week high on Tuesday, summing to a rally of around 475 pips over the past three trading days. Spot prices stick to the modest intraday gains through the early European session and currently trade around the 142.70 region, up nearly 0.30% for the day.
Despite the Bank of Japan’s (BoJ) steps last week to tweak its Yield Curve Control (YCC) policy, the dovish outlook continues to undermine the Japanese Yen (JPY). In fact, BoJ Governor Kazuo Ueda reiterated the need to maintain monetary support and said that the central bank won’t hesitate to ease policy further. Ueda added that more time was needed to sustainably achieve the 2% inflation target. Furthermore, the Japanese central bank announced an unscheduled debt-buying operation on Monday to help contain rising local government bond yields. This, along with the prevalent risk-on environment, is seen weighing on the safe-haven JPY and acting as a tailwind for the USD/JPY pair.
Investors continue to cheer the latest optimism over more stimulus measures from China, which, to a larger extent, overshadows the incoming weaker data and remains supportive of the underlying bullish sentiment across the global equity markets. Apart from this, some follow-through US Dollar (USD) buying provides an additional lift to the USD/JPY pair. In fact, the USD Index, which tracks the Greenback against a basket of currencies, climbs to its highest level since July 10 in the wake of expectations for further policy tightening by the Federal Reserve (Fed). The bets were lifted by the upbeat US GDP report released last week, which pointed to an extremely resilient economy.
Moreover, Fed Chair Jerome Powell had said that the economy still needs to slow and the labour market to weaken for inflation to credibly return to the 2% target. This, in turn, is seen pushing the US Treasury bond yields higher and lending support to the Greenback. Market participants now look to the US economic docket, featuring the release of the ISM Manufacturing PMI and JOLTS Job Openings data. This might influence the USD price dynamics, which, along with the broader risk sentiment, should provide some impetus to the USD./JPY pair. Nevertheless, the aforementioned fundamental backdrop suggests that the path of least resistance for spot prices is to the upside.
Technical Levels: Supports and Resistances
USDJPY currently trading at 142.67 at the time of writing. Pair opened at 142.29 and is trading with a change of 0.27 % .
| Overview | Overview.1 | |
|---|---|---|
| 0 | Today last price | 142.67 |
| 1 | Today Daily Change | 0.38 |
| 2 | Today Daily Change % | 0.27 |
| 3 | Today daily open | 142.29 |
The pair remains strongly bullish on the daily timeframe. It trades above its 20 SMA @ 140.85, 50 SMA 141.04, 100 SMA @ 137.51 and 200 SMA @ 136.67.
| Trends | Trends.1 | |
|---|---|---|
| 0 | Daily SMA20 | 140.85 |
| 1 | Daily SMA50 | 141.04 |
| 2 | Daily SMA100 | 137.51 |
| 3 | Daily SMA200 | 136.67 |
The previous day high was 142.7 while the previous day low was 140.69. The daily 38.2% Fib levels comes at 141.93, expected to provide support. Similarly, the daily 61.8% fib level is at 141.46, expected to provide support.
Note the levels of interest below:
- Pivot support is noted at 141.09, 139.89, 139.09
- Pivot resistance is noted at 143.1, 143.9, 145.1
| Levels | Levels.1 |
|---|---|
| Previous Daily High | 142.70 |
| Previous Daily Low | 140.69 |
| Previous Weekly High | 141.82 |
| Previous Weekly Low | 138.07 |
| Previous Monthly High | 144.91 |
| Previous Monthly Low | 137.24 |
| Daily Fibonacci 38.2% | 141.93 |
| Daily Fibonacci 61.8% | 141.46 |
| Daily Pivot Point S1 | 141.09 |
| Daily Pivot Point S2 | 139.89 |
| Daily Pivot Point S3 | 139.09 |
| Daily Pivot Point R1 | 143.10 |
| Daily Pivot Point R2 | 143.90 |
| Daily Pivot Point R3 | 145.10 |
[/s2If]
Download Nehcap EAWe have two EAs that are operational on our LIVE accounts.
- EA-FIX: Check out the details here. Download EA-FIX . EA-FIX is a non-grid HFT scalper.
- EA-GROWTH: High quality low dd EA using trend grids. Download EA_GROWTHJoin Our Telegram Group
")


