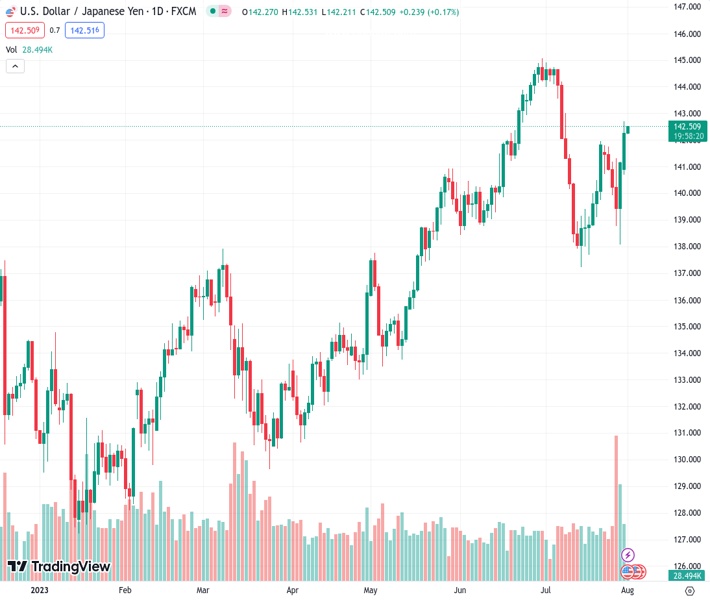
The USDJPY currency pair, currently trading at 142.481, is observed to be consolidating its substantial recent advances, which led it to reach a three-week peak earlier in the week.
…
This is a premium post.
[s2If !current_user_can(access_s2member_level4)]Please register for FREE REGISTER to read full post below containing analysis. In case of any error or you think you are not able to read the full post below, please email us at support#nehcap.com [lwa][/s2If] [s2If current_user_can(access_s2member_level1)]
- USD/JPY is seen consolidating its recent strong gains to a three-week high touched on Monday.
The pair currently trades last at 142.481.
The previous day high was 142.7 while the previous day low was 140.69. The daily 38.2% Fib levels comes at 141.93, expected to provide support. Similarly, the daily 61.8% fib level is at 141.46, expected to provide support.
The USD/JPY pair oscillates in a narrow band during the Asian session on Tuesday and consolidates its gains registered over the past two days. Spot prices currently trade around the 142.35-142.40 region, just below a three-week high touched the previous day and seem poised to build on the recent solid bounce from the 138.00 neighboudhood.
The Bank of Japan’s unscheduled operation on Monday to buy ¥300 billion ($2 billion) worth of Japanese government bonds (JGB) – to keep yields pinned down for the first time since February 2022 – continues to weigh on the Japanese Yen (JPY). It is worth recalling that the yield of benchmark 10-year JGB surged to a nine-year high in reaction to the BoJ’s decision to be more flexible in its Yield Curve Control (YCC) policy. Apart from this, a generally positive risk tone is seen as another factor undermining the safe-haven JPY and acts as a tailwind for the USD/JPY pair.
The US Dollar (USD), on the other hand, holds steady near its highest level since July 10 set last Friday and remains well supported by the increasing likelihood that the Federal Reserve (Fed) could hike interest rates further. The bets were lifted by the upbeat US GDP report released last week, which pointed to an extremely resilient economy and supported prospects for further tightening by the Fed. Moreover Fed Chair Jerome Powell had said last week that the economy still needs to slow and the labour market to weaken for inflation to credibly return to the 2% target.
That said, signs of receding underlying price pressures in the US could allow the Fed to soften its hawkish stance. In fact, the US Bureau of Economic Analysis reported on Friday that the PCE Price Index advanced 3.0% over the twelve months through June, registering its smallest gains since March 2021. Excluding the volatile food and energy components, the Core PCE Price Index came in at 4.1% YoY rate – the smallest increase since September 2021. This could force the Fed to end its fastest rate-hiking cycle since the 1980s and might cap the USD and the USD/JPY pair.
The fundamental backdrop, meanwhile, seems tilted in favour of bullish traders and suggests that the path of least resistance for the spot prices is to the downside. Traders, however, seem reluctant to place aggressive bets and prefer to wait for a fresh impetus from this week’s release of important US macro data scheduled at the beginning of a new month, starting with the release of the ISM Manufacturing PMI later during the early North American session. The focus, however, will remain glued to the closely-watched monthly employment details, or the NFP report on Friday,
Technical Levels: Supports and Resistances
USDJPY currently trading at 142.38 at the time of writing. Pair opened at 142.29 and is trading with a change of 0.06 % .
| Overview | Overview.1 | |
|---|---|---|
| 0 | Today last price | 142.38 |
| 1 | Today Daily Change | 0.09 |
| 2 | Today Daily Change % | 0.06 |
| 3 | Today daily open | 142.29 |
The pair remains strongly bullish on the daily timeframe. It trades above its 20 SMA @ 140.85, 50 SMA 141.04, 100 SMA @ 137.51 and 200 SMA @ 136.67.
| Trends | Trends.1 | |
|---|---|---|
| 0 | Daily SMA20 | 140.85 |
| 1 | Daily SMA50 | 141.04 |
| 2 | Daily SMA100 | 137.51 |
| 3 | Daily SMA200 | 136.67 |
The previous day high was 142.7 while the previous day low was 140.69. The daily 38.2% Fib levels comes at 141.93, expected to provide support. Similarly, the daily 61.8% fib level is at 141.46, expected to provide support.
Note the levels of interest below:
- Pivot support is noted at 141.09, 139.89, 139.09
- Pivot resistance is noted at 143.1, 143.9, 145.1
| Levels | Levels.1 |
|---|---|
| Previous Daily High | 142.70 |
| Previous Daily Low | 140.69 |
| Previous Weekly High | 141.82 |
| Previous Weekly Low | 138.07 |
| Previous Monthly High | 144.91 |
| Previous Monthly Low | 137.24 |
| Daily Fibonacci 38.2% | 141.93 |
| Daily Fibonacci 61.8% | 141.46 |
| Daily Pivot Point S1 | 141.09 |
| Daily Pivot Point S2 | 139.89 |
| Daily Pivot Point S3 | 139.09 |
| Daily Pivot Point R1 | 143.10 |
| Daily Pivot Point R2 | 143.90 |
| Daily Pivot Point R3 | 145.10 |
[/s2If]
Download Nehcap EAWe have two EAs that are operational on our LIVE accounts.
- EA-FIX: Check out the details here. Download EA-FIX . EA-FIX is a non-grid HFT scalper.
- EA-GROWTH: High quality low dd EA using trend grids. Download EA_GROWTHJoin Our Telegram Group
")


