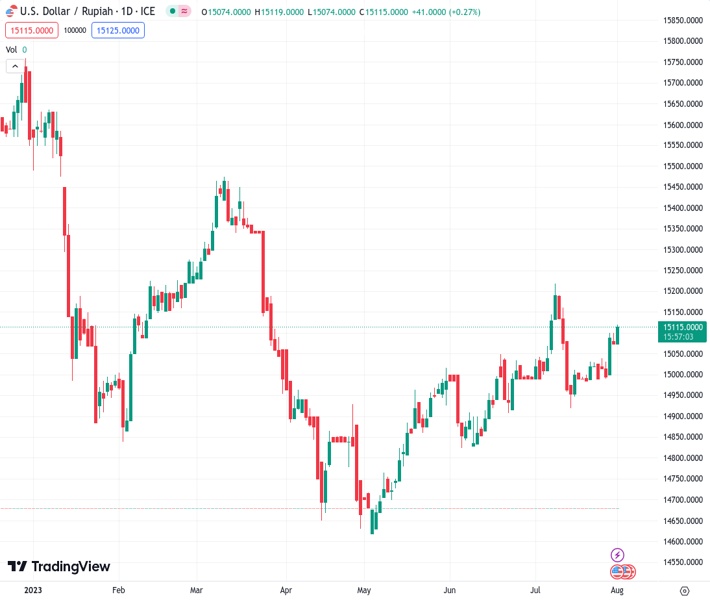
The USDIDR is showing slight increases following disappointing inflation data in Indonesia and a stronger US Dollar.
…
This is a premium post.
[s2If !current_user_can(access_s2member_level4)]Please register for FREE REGISTER to read full post below containing analysis. In case of any error or you think you are not able to read the full post below, please email us at support#nehcap.com [lwa][/s2If] [s2If current_user_can(access_s2member_level1)]
- USD/IDR prints mild gains amid downbeat Indonesia inflation data, firmer US Dollar.
The pair currently trades last at 15115.0.
The previous day high was 15112.0 while the previous day low was 15062.95. The daily 38.2% Fib levels comes at 15081.6871, expected to provide support. Similarly, the daily 61.8% fib level is at 15093.2629, expected to provide support.
USD/IDR justifies downbeat Indonesia Inflation during early Thursday as bulls prod the 15,120 level to print mild gains heading into the European session. Apart from the downbeat Indonesia inflation, the firmer US Dollar also favors the Indonesia Rupiah (IDR) bears.
That said, Indonesia’s Inflation eases to 3.08% YoY in June from 3.52% prior, compared to 3.1% expected, whereas the Core Inflation also edges lower to 2.43% versus 2.50% market forecasts and 2.58% previous readings.
On the other hand, the Dollar Index (DXY) clings to mild gains at a three-week high of around 102.00 marked earlier in the day.
It’s worth noting that the hawkish comments from the Fed officials and mixed US data join downbeat headlines about China to also propel the USD/IDR prices amid a risk-on mood in the Asia-Pacific zone.
That said, Chicago Fed President Austan Goolsbee defends the US central bank’s hawkish moves while Dallas Fed Manufacturing Business Index improves to -20.0 for July from -23.2 prior versus -26.3 expected. Further, Chicago PMI rose to 42.8 from 41.5 prior versus 43.0 market forecasts. In doing so, the DXY ignores Friday’s softer prints of US inflation clues and the weekend comments from Minneapolis Fed President Neel Kashkari’s criticism of higher interest rates.
Elsewhere, fresh fears of the US-China tussle, as Beijing restricts drone exports in retaliation to the US tech and trade war tactics by citing the “national security” measures, prod the optimists in the Asian-Pacific zone. Also weighing on the sentiment could be the downbeat China PMI as Caixin Manufacturing PMI for July fails to trace its upbeat NBS counterpart while declining to 49.2 for July from 50.5 prior, versus 50.3 market forecasts, marking the lowest level since January.
Looking ahead, US ISM Manufacturing PMI for July and JOLTS Job Opening for June will direct intraday moves of the Indonesia Rupiah. However, major attention will be given to Friday’s Indonesia Gross Domestic Product (GDP) for the second quarter (Q2) and the US Nonfarm Payrolls (NFP) for clear directions.
A daily closing beyond 15,150 becomes necessary for the USD/IDR bulls to challenge the yearly top of around 15,230. That said, the 15,000 round figure puts a floor under the Indonesia Rupiah prices.
Technical Levels: Supports and Resistances
USDIDR currently trading at 15120 at the time of writing. Pair opened at 15091.55 and is trading with a change of 0.19% % .
| Overview | Overview.1 | |
|---|---|---|
| 0 | Today last price | 15120 |
| 1 | Today Daily Change | 28.4500 |
| 2 | Today Daily Change % | 0.19% |
| 3 | Today daily open | 15091.55 |
The pair is trading above its 20 Daily moving average @ 15052.855, above its 50 Daily moving average @ 14992.235 , above its 100 Daily moving average @ 14966.6985 and below its 200 Daily moving average @ 15193.8255
| Trends | Trends.1 | |
|---|---|---|
| 0 | Daily SMA20 | 15052.8550 |
| 1 | Daily SMA50 | 14992.2350 |
| 2 | Daily SMA100 | 14966.6985 |
| 3 | Daily SMA200 | 15193.8255 |
The previous day high was 15112.0 while the previous day low was 15062.95. The daily 38.2% Fib levels comes at 15081.6871, expected to provide support. Similarly, the daily 61.8% fib level is at 15093.2629, expected to provide support.
Note the levels of interest below:
- Pivot support is noted at 15065.6667, 15039.7833, 15016.6167
- Pivot resistance is noted at 15114.7167, 15137.8833, 15163.7667
| Levels | Levels.1 |
|---|---|
| Previous Daily High | 15112.0000 |
| Previous Daily Low | 15062.9500 |
| Previous Weekly High | 15139.0000 |
| Previous Weekly Low | 14964.3500 |
| Previous Monthly High | 15916.7000 |
| Previous Monthly Low | 13588.0000 |
| Daily Fibonacci 38.2% | 15081.6871 |
| Daily Fibonacci 61.8% | 15093.2629 |
| Daily Pivot Point S1 | 15065.6667 |
| Daily Pivot Point S2 | 15039.7833 |
| Daily Pivot Point S3 | 15016.6167 |
| Daily Pivot Point R1 | 15114.7167 |
| Daily Pivot Point R2 | 15137.8833 |
| Daily Pivot Point R3 | 15163.7667 |
[/s2If]
Download Nehcap EAWe have two EAs that are operational on our LIVE accounts.
- EA-FIX: Check out the details here. Download EA-FIX . EA-FIX is a non-grid HFT scalper.
- EA-GROWTH: High quality low dd EA using trend grids. Download EA_GROWTHJoin Our Telegram Group
")


