The USDCAD currency pair remains strong, despite reducing its largest daily decline in a fortnight.
…
This is a premium post.
[s2If !current_user_can(access_s2member_level4)]Please register for FREE REGISTER to read full post below containing analysis. In case of any error or you think you are not able to read the full post below, please email us at support#nehcap.com [lwa][/s2If] [s2If current_user_can(access_s2member_level1)]
- USD/CAD stays firmer while paring the biggest daily loss in two weeks.
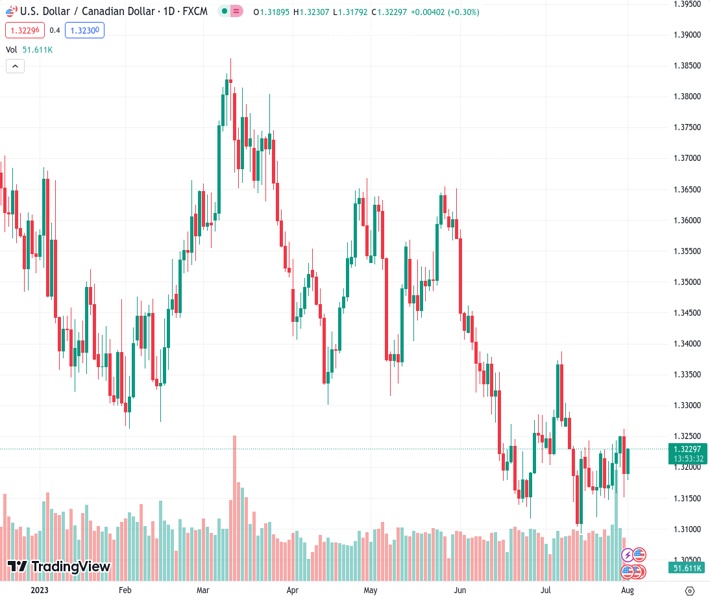
The pair currently trades last at 1.32303.
The previous day high was 1.3262 while the previous day low was 1.3151. The daily 38.2% Fib levels comes at 1.3193, expected to provide support. Similarly, the daily 61.8% fib level is at 1.3219, expected to provide support.
USD/CAD bulls keep the reins around 1.3230 as they prod the intraday high heading into Tuesday’s European session amid a firmer US Dollar and a retreat in Canada’s key export item WTI crude oil. In doing so, the Loonie pair consolidates the biggest daily loss in a fortnight ahead of the July activity data from the US and Canada.
That said, the Dollar Index (DXY) clings to mild gains at a three-week high of around 102.00 marked earlier in the day as upbeat Fed talks join firmer US data and downbeat China statistics.
On Monday, Chicago Fed President Austan Goolsbee defends the US central bank’s hawkish moves while Dallas Fed Manufacturing Business Index improves to -20.0 for July from -23.2 prior versus -26.3 expected. Further, Chicago’s PMI rose to 42.8 from 41.5 prior versus 43.0 market forecasts. In doing so, the DXY ignores Friday’s softer prints of US inflation clues and the weekend comments from Minneapolis Fed President Neel Kashkari’s criticism of higher interest rates.
China’s Caixin Manufacturing PMI for July fails to trace its upbeat NBS counterpart while declining to 49.2 for July from 50.5 prior, versus 50.3 market forecasts, marking the lowest level since January.
It’s worth noting that the fears of the US-China tussle, as Beijing restricts drone exports in retaliation to the US tech and trade war tactics by citing the “national security” measures, prod the optimists and allow the US Dollar to remain firmer due to its have appeal.
Elsewhere, WTI crude oil prints the first daily loss in four while retreating from the highest level since April 17, down 0.30% intraday to $81.30 by the press time, amid fears of receding energy demand from China, as well as due to the firmer US Dollar.
Looking ahead, Canada S&P Global Manufacturing PMI for July will join the US ISM Manufacturing PMI for the said month, as well as the US JOLTS Job Openings for June, to direct intraday moves of the USD/CAD pair. Also important will be the weekly crude oil inventory data from the American Petroleum Institute (API).
USD/CAD extends recovery from a 12-day-old rising support line, close to 1.3180 by the press time, as bulls approach the 50-DMA hurdle of around 1.3295.
Technical Levels: Supports and Resistances
USDCAD currently trading at 1.3226 at the time of writing. Pair opened at 1.319 and is trading with a change of 0.27% % .
| Overview | Overview.1 | |
|---|---|---|
| 0 | Today last price | 1.3226 |
| 1 | Today Daily Change | 0.0036 |
| 2 | Today Daily Change % | 0.27% |
| 3 | Today daily open | 1.319 |
The pair is trading above its 20 Daily moving average @ 1.3216, below its 50 Daily moving average @ 1.3299 , below its 100 Daily moving average @ 1.3418 and below its 200 Daily moving average @ 1.3461
| Trends | Trends.1 | |
|---|---|---|
| 0 | Daily SMA20 | 1.3216 |
| 1 | Daily SMA50 | 1.3299 |
| 2 | Daily SMA100 | 1.3418 |
| 3 | Daily SMA200 | 1.3461 |
The previous day high was 1.3262 while the previous day low was 1.3151. The daily 38.2% Fib levels comes at 1.3193, expected to provide support. Similarly, the daily 61.8% fib level is at 1.3219, expected to provide support.
Note the levels of interest below:
- Pivot support is noted at 1.314, 1.309, 1.303
- Pivot resistance is noted at 1.3251, 1.3311, 1.3361
| Levels | Levels.1 |
|---|---|
| Previous Daily High | 1.3262 |
| Previous Daily Low | 1.3151 |
| Previous Weekly High | 1.3255 |
| Previous Weekly Low | 1.3147 |
| Previous Monthly High | 1.3387 |
| Previous Monthly Low | 1.3093 |
| Daily Fibonacci 38.2% | 1.3193 |
| Daily Fibonacci 61.8% | 1.3219 |
| Daily Pivot Point S1 | 1.3140 |
| Daily Pivot Point S2 | 1.3090 |
| Daily Pivot Point S3 | 1.3030 |
| Daily Pivot Point R1 | 1.3251 |
| Daily Pivot Point R2 | 1.3311 |
| Daily Pivot Point R3 | 1.3361 |
[/s2If]
Download Nehcap EAWe have two EAs that are operational on our LIVE accounts.
- EA-FIX: Check out the details here. Download EA-FIX . EA-FIX is a non-grid HFT scalper.
- EA-GROWTH: High quality low dd EA using trend grids. Download EA_GROWTHJoin Our Telegram Group
")


