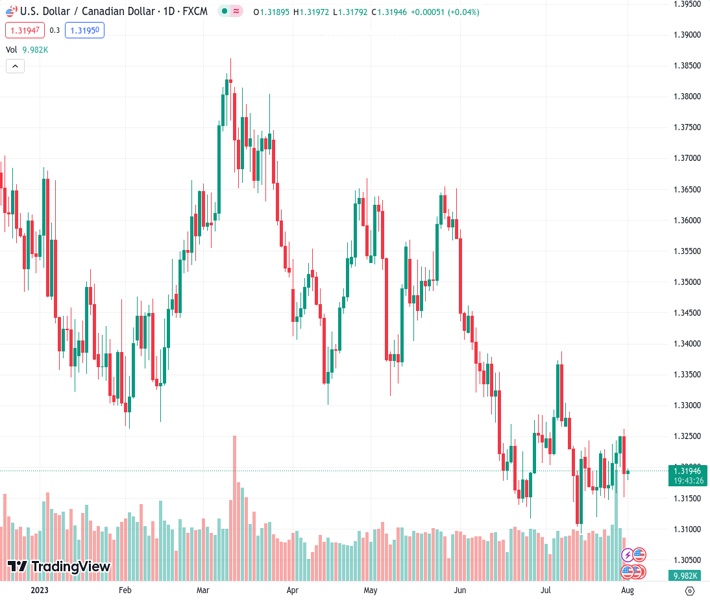
The USDCAD currency pair is currently trading at 1.31970, and it is showing increased momentum around the 1.3195 level, with a 0.04% increase on Tuesday.
…
This is a premium post.
[s2If !current_user_can(access_s2member_level4)]Please register for FREE REGISTER to read full post below containing analysis. In case of any error or you think you are not able to read the full post below, please email us at support#nehcap.com [lwa][/s2If] [s2If current_user_can(access_s2member_level1)]
- USD/CAD gains traction near 1.3195, up 0.04% on Tuesday.
The pair currently trades last at 1.31970.
The previous day high was 1.3262 while the previous day low was 1.3151. The daily 38.2% Fib levels comes at 1.3193, expected to provide support. Similarly, the daily 61.8% fib level is at 1.3219, expected to provide resistance.
The USD/CAD pair stalls the previous day’s pullback and gains traction below the 1.3200 barrier during the early Asian session on Tuesday. Meanwhile, the US Dollar Index (DXY), a measure of the value of the Greenback against a basket of six major currencies, gains momentum near 101.95, gaining 0.08% for the day. Market participants await the US ISM Manufacturing Purchasing Managers Index (PMI) data later in the North American session ahead of the Canadian employment data and the US Nonfarm Payrolls on Friday.
On Monday, the United States released low-tier economic data. The US Chicago Purchasing Managers Index (PMI) for July increased to 42.8 from 41.5 in June,above market expectations of 43, while the Dallas Manufacturing Index increased to -20 from -23.2 in July.
The evidence of easing underlying price pressures in the United States might convince the Fed to ease its hawkish stance. That said, the Personal Consumption Expenditures (PCE) Price Index decreased from 3.8% in May to 3% in June, below the market’s expectation of 3.1%. The Core PCE Price Index came in at 4.1% annually, down from 4.6% in May and below market expectations of 4.2%. The softer data could bring the Federal Reserve (Fed) closer to the end of its rate-hiking cycle. This may limit the US Dollar’s upside and act as a headwind for USD/CAD.
On the Canadian Dollar front, the Bank of Canada (BoC) policymakers indicated they are still likely to further hike their benchmark interest rate after raising it by 25 basis points (bps) to 5.0% on July 12. BoC Governor Tiff Macklem disclosed that future policy decisions would be based on incoming data and the inflation outlook. However, market participants anticipated that the Bank of Canada (BoC) would not deem it necessary to increase interest rates further this year.
About the data, the Canadian Gross Domestic Product (GDP) expanded by 0.3% in May, as expected. However, the figure is likely to contract in June, suggesting an economic slowdown in the country. This might signal the end of the Bank of Canada’s (BoC) tightening cycle, which has sent interest rates to a 22-year high.
Meanwhile, the uptick in oil prices has supported the Loonie and offset a slowdown in the Canadian manufacturing sector. Higher crude prices strengthen the Canadian Dollar, as the country is the leading oil exporter to the United States.
Later in the day, investors await the US ISM Manufacturing Purchasing Managers Index (PMI) data. On Friday, attention will shift to Canadian employment data and Nonfarm payrolls. The US economy is expected to have created 180,000 jobs. Also, the JOLTS Job Openings report, ADP Private Employment, Weekly Jobless Claims, and Unit Labour Cost will be released later this week. The data will be critical for determining a clear movement for the USD/CAD pair.
Technical Levels: Supports and Resistances
USDCAD currently trading at 1.3194 at the time of writing. Pair opened at 1.319 and is trading with a change of 0.03 % .
| Overview | Overview.1 | |
|---|---|---|
| 0 | Today last price | 1.3194 |
| 1 | Today Daily Change | 0.0004 |
| 2 | Today Daily Change % | 0.0300 |
| 3 | Today daily open | 1.3190 |
The pair remains strongly bearish on the daily time frame. It trades below the 20 SMA @ 1.3216, 50 SMA 1.3299, 100 SMA @ 1.3418 and 200 SMA @ 1.3461.
| Trends | Trends.1 | |
|---|---|---|
| 0 | Daily SMA20 | 1.3216 |
| 1 | Daily SMA50 | 1.3299 |
| 2 | Daily SMA100 | 1.3418 |
| 3 | Daily SMA200 | 1.3461 |
The previous day high was 1.3262 while the previous day low was 1.3151. The daily 38.2% Fib levels comes at 1.3193, expected to provide support. Similarly, the daily 61.8% fib level is at 1.3219, expected to provide resistance.
Note the levels of interest below:
- Pivot support is noted at 1.314, 1.309, 1.303
- Pivot resistance is noted at 1.3251, 1.3311, 1.3361
| Levels | Levels.1 |
|---|---|
| Previous Daily High | 1.3262 |
| Previous Daily Low | 1.3151 |
| Previous Weekly High | 1.3255 |
| Previous Weekly Low | 1.3147 |
| Previous Monthly High | 1.3387 |
| Previous Monthly Low | 1.3093 |
| Daily Fibonacci 38.2% | 1.3193 |
| Daily Fibonacci 61.8% | 1.3219 |
| Daily Pivot Point S1 | 1.3140 |
| Daily Pivot Point S2 | 1.3090 |
| Daily Pivot Point S3 | 1.3030 |
| Daily Pivot Point R1 | 1.3251 |
| Daily Pivot Point R2 | 1.3311 |
| Daily Pivot Point R3 | 1.3361 |
[/s2If]
Download Nehcap EAWe have two EAs that are operational on our LIVE accounts.
- EA-FIX: Check out the details here. Download EA-FIX . EA-FIX is a non-grid HFT scalper.
- EA-GROWTH: High quality low dd EA using trend grids. Download EA_GROWTHJoin Our Telegram Group
")


