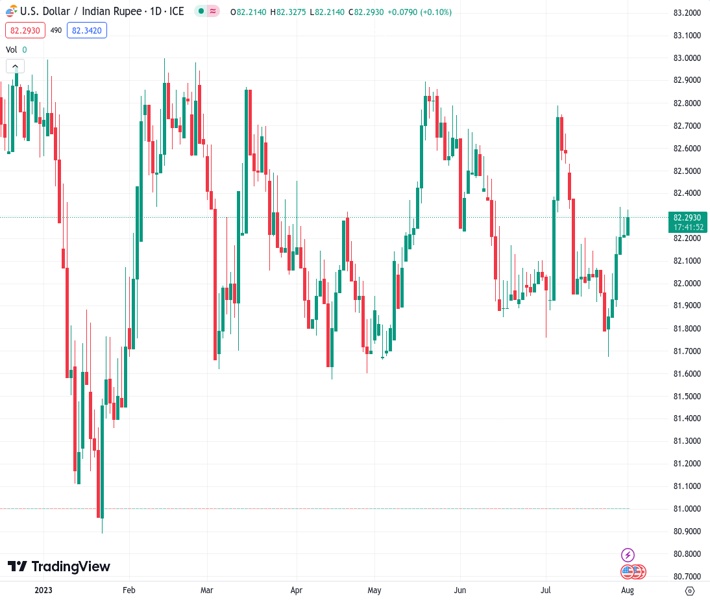
The USD to INR exchange rate is currently at 82.3175 and is showing an increase in strength around 82.28, marking a 0.02% gain for the day.
…
This is a premium post.
[s2If !current_user_can(access_s2member_level4)]Please register for FREE REGISTER to read full post below containing analysis. In case of any error or you think you are not able to read the full post below, please email us at support#nehcap.com [lwa][/s2If] [s2If current_user_can(access_s2member_level1)]
- USD/INR gains traction around 82.28, gaining 0.02% for the day.
The pair currently trades last at 82.3175.
The previous day high was 82.369 while the previous day low was 82.2. The daily 38.2% Fib levels comes at 82.3044, expected to provide support. Similarly, the daily 61.8% fib level is at 82.2646, expected to provide support.
The USD/INR pair attracts some buyers during the Asian session on Tuesday. The pair currently trades within a large consolidation phase since October 2022 and holds above 82.20. The uptick in USD/INR is bolstered by the strength of the Greenback. The US dollar Index (DXY), a measure of the value of USD against a basket of six influential currencies, rebounds above the 102.00 area following last week’s gains against its rivals.
The escalating tensions between the US and China over access to technology exert some pressure on the Indian Rupee (INR) and benefit the safe-haven US Dollar. On Monday, China announced export restrictions on some drones and drone-related equipment to the US, citing “national security and interests”. The restriction will go into effect on September 1, according to the commerce ministry.
On the other hand, evidence of alleviating underlying price pressures in the United States might convince the Federal Reserve (Fed) to adopt a less hawkish stance. The Personal Consumption Expenditures (PCE) Price Index decreased from 3.8% in May to 3% in June, below the market’s expectation of 3.1%. While the Core PCE Price Index came in at 4.1% annually, down from 4.6% in May and below market expectations of 4.2%, The possibility of the Fed ending its rate-hiking cycle might cap the US Dollar ’s upside and act as a headwind for USD/INR.
Moving on, market participants will closely watch the Nonfarm Payrolls (NFT) report due on Friday. The US economy is expected to have created 180,000 jobs. This event could significantly impact the US Dollar’s dynamic and give the USD/INR pair a clear direction. Additionally, the JOLTS Job Openings report, ADP Private Employment, Weekly Jobless Claims, and Unit Labour Cost will be released later this week.
From the technical perspective, two converging trend lines constitute the formation of a symmetrical triangle pattern on the daily chart. The Relative Strength Index (RSI) holds above 50, supporting the buyers for now.
Resistance levels: 82.75, 83.00, and 83.20
Support levels: 81.90, 81.70, and 81.10
Technical Levels: Supports and Resistances
USDINR currently trading at 82.2984 at the time of writing. Pair opened at 82.2856 and is trading with a change of 0.02 % .
| Overview | Overview.1 | |
|---|---|---|
| 0 | Today last price | 82.2984 |
| 1 | Today Daily Change | 0.0128 |
| 2 | Today Daily Change % | 0.0200 |
| 3 | Today daily open | 82.2856 |
The pair remains strongly bullish on the daily timeframe. It trades above its 20 SMA @ 82.209, 50 SMA 82.2551, 100 SMA @ 82.1972 and 200 SMA @ 82.1595.
| Trends | Trends.1 | |
|---|---|---|
| 0 | Daily SMA20 | 82.2090 |
| 1 | Daily SMA50 | 82.2551 |
| 2 | Daily SMA100 | 82.1972 |
| 3 | Daily SMA200 | 82.1595 |
The previous day high was 82.369 while the previous day low was 82.2. The daily 38.2% Fib levels comes at 82.3044, expected to provide support. Similarly, the daily 61.8% fib level is at 82.2646, expected to provide support.
Note the levels of interest below:
- Pivot support is noted at 82.2007, 82.1159, 82.0317
- Pivot resistance is noted at 82.3697, 82.4538, 82.5387
| Levels | Levels.1 |
|---|---|
| Previous Daily High | 82.3690 |
| Previous Daily Low | 82.2000 |
| Previous Weekly High | 82.3860 |
| Previous Weekly Low | 81.6588 |
| Previous Monthly High | 82.8334 |
| Previous Monthly Low | 81.6588 |
| Daily Fibonacci 38.2% | 82.3044 |
| Daily Fibonacci 61.8% | 82.2646 |
| Daily Pivot Point S1 | 82.2007 |
| Daily Pivot Point S2 | 82.1159 |
| Daily Pivot Point S3 | 82.0317 |
| Daily Pivot Point R1 | 82.3697 |
| Daily Pivot Point R2 | 82.4538 |
| Daily Pivot Point R3 | 82.5387 |
[/s2If]
Download Nehcap EAWe have two EAs that are operational on our LIVE accounts.
- EA-FIX: Check out the details here. Download EA-FIX . EA-FIX is a non-grid HFT scalper.
- EA-GROWTH: High quality low dd EA using trend grids. Download EA_GROWTHJoin Our Telegram Group
")


