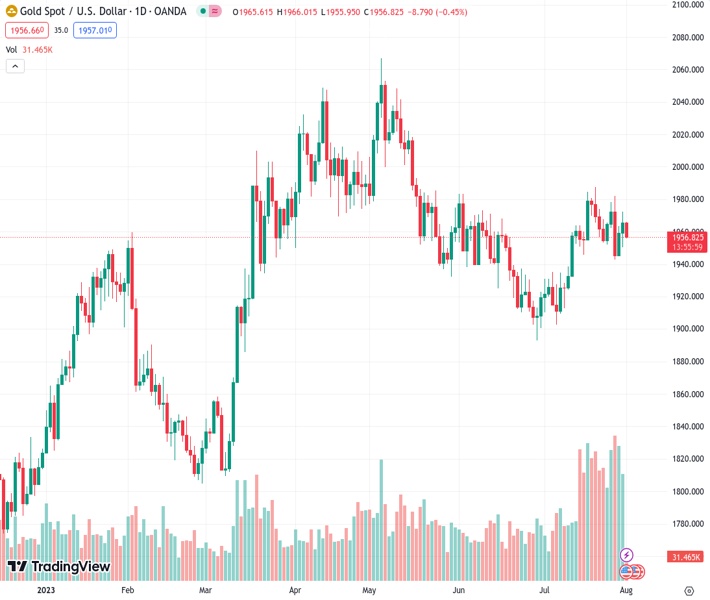
The price of gold, trading under the symbol XAUUSD, is currently trading defensively close to $1,955, which represents a 0.41% decrease for the day.
…
This is a premium post.
[s2If !current_user_can(access_s2member_level4)]Please register for FREE REGISTER to read full post below containing analysis. In case of any error or you think you are not able to read the full post below, please email us at support#nehcap.com [lwa][/s2If] [s2If current_user_can(access_s2member_level1)]
- Gold price trades on the defensive near $1,955, down 0.41% for the day.
The pair currently trades last at 1957.27.
The previous day high was 1972.45 while the previous day low was 1950.67. The daily 38.2% Fib levels comes at 1964.13, expected to provide resistance. Similarly, the daily 61.8% fib level is at 1958.99, expected to provide resistance.
The gold price loses momentum around $1,955 heading into the early European session. XAU/USD faces some follow-through selling as US-China tensions over access to technology escalate, and the US Dollar strengthens across the board. Meanwhile, the US Dollar Index (DXY), a measure of the value of the Greenback against a basket of six major currencies, gains momentum above 102.00.
Chinese authorities announced additional policy guidelines on Monday. Still, no specific plans to bolster the faltering economy and domestic consumption, leaving investors wanting as lackluster activity data increased pressure on officials to act.
The Chinese Caixin Manufacturing PMI for July fell to 49.2 from 50.5 prior, versus the market consensus of 50.3. This figure marked the lowest level since January. This, in turn, caps the upside in precious metals, as China is one of the largest gold consumers. Additionally, the Manufacturing Purchasing Managers’ Index (PMI) increased to 49.3 in July, improving from 49.0 in June and the market’s expectation of 49.2. However, the figure was marked below 50 for the fourth straight month, indicating the contraction zone. Meanwhile, the NBS Services PMI fell from 53.2 in June to 51.5 in July.
On the other hand, the evidence of easing underlying price pressures in the United States might convince the Fed to ease its hawkish stance. That said, the Personal Consumption Expenditures (PCE) Price Index decreased from 3.8% in May to 3% in June, below the market’s expectation of 3.1%. The Core PCE Price Index came in at 4.1% annually, down from 4.6% in May and below market expectations of 4.2%.
The softer data could bring the Federal Reserve (Fed) closer to the end of its rate-hiking cycle. This may limit the US Dollar’s upside and act as a tailwind for the gold price. It’s worth noting that gold is sensitive to rising interest rates as they raise the opportunity cost of holding non-yielding bullion.
Furthermore, the renewed trade war tensions between the US-China over access to technology might exert some pressure on the gold price. China’s authorities announced on Monday export restrictions on some drones and drone-related equipment to the US, citing “national security and interests”. The restriction will go into effect on September 1, according to the commerce ministry.
Market participants await the US ISM Manufacturing Purchasing Managers Index (PMI) data later in the North American session for a clear direction in XAU/USD. Also, the JOLTS Job Openings report, ADP Private Employment, Weekly Jobless Claims, and Unit Labour Cost will be released later this week. The highlight of the week will be the US Nonfarm Payrolls (NFP). These data might influence the USD price dynamics and determine short-term trading opportunities around the gold price. Also, the headline surrounding the Sino-US relationship remains in focus.
Technical Levels: Supports and Resistances
XAUUSD currently trading at 1957.47 at the time of writing. Pair opened at 1965.06 and is trading with a change of -0.39 % .
| Overview | Overview.1 | |
|---|---|---|
| 0 | Today last price | 1957.47 |
| 1 | Today Daily Change | -7.59 |
| 2 | Today Daily Change % | -0.39 |
| 3 | Today daily open | 1965.06 |
The pair is trading above its 20 Daily moving average @ 1950.56, above its 50 Daily moving average @ 1946.46 , below its 100 Daily moving average @ 1968.1 and above its 200 Daily moving average @ 1889.28
| Trends | Trends.1 | |
|---|---|---|
| 0 | Daily SMA20 | 1950.56 |
| 1 | Daily SMA50 | 1946.46 |
| 2 | Daily SMA100 | 1968.10 |
| 3 | Daily SMA200 | 1889.28 |
The previous day high was 1972.45 while the previous day low was 1950.67. The daily 38.2% Fib levels comes at 1964.13, expected to provide resistance. Similarly, the daily 61.8% fib level is at 1958.99, expected to provide resistance.
Note the levels of interest below:
- Pivot support is noted at 1953.0, 1940.95, 1931.22
- Pivot resistance is noted at 1974.78, 1984.51, 1996.56
| Levels | Levels.1 |
|---|---|
| Previous Daily High | 1972.45 |
| Previous Daily Low | 1950.67 |
| Previous Weekly High | 1982.20 |
| Previous Weekly Low | 1942.65 |
| Previous Monthly High | 1987.54 |
| Previous Monthly Low | 1902.77 |
| Daily Fibonacci 38.2% | 1964.13 |
| Daily Fibonacci 61.8% | 1958.99 |
| Daily Pivot Point S1 | 1953.00 |
| Daily Pivot Point S2 | 1940.95 |
| Daily Pivot Point S3 | 1931.22 |
| Daily Pivot Point R1 | 1974.78 |
| Daily Pivot Point R2 | 1984.51 |
| Daily Pivot Point R3 | 1996.56 |
[/s2If]
Download Nehcap EAWe have two EAs that are operational on our LIVE accounts.
- EA-FIX: Check out the details here. Download EA-FIX . EA-FIX is a non-grid HFT scalper.
- EA-GROWTH: High quality low dd EA using trend grids. Download EA_GROWTHJoin Our Telegram Group
")


