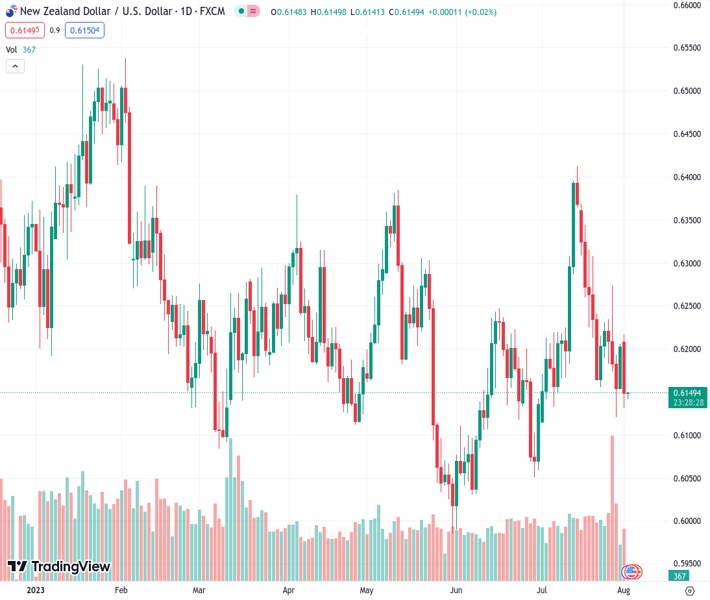
The New Zealand Dollar to US Dollar pair, trading at 0.61441, experienced a significant decline close to the 0.6150 region, dropping by over 0.90%.
…
This is a premium post.
[s2If !current_user_can(access_s2member_level4)]Please register for FREE REGISTER to read full post below containing analysis. In case of any error or you think you are not able to read the full post below, please email us at support#nehcap.com [lwa][/s2If] [s2If current_user_can(access_s2member_level1)]
- NZD/USD fell near the 0.6150 area, losing more than 0.90%.
The pair currently trades last at 0.61441.
The previous day high was 0.6226 while the previous day low was 0.6149. The daily 38.2% Fib levels comes at 0.6197, expected to provide resistance. Similarly, the daily 61.8% fib level is at 0.6178, expected to provide resistance.
On Tuesday’s session, the NZD/USD fell sharply as markets await critical labour market data from New Zealand from Q2. As for now, the Reserve Bank of New Zealand (RBNZ) pointed out that they were done with tightening and hinted that they will hold rates at restrictive levels for some time.
As for now, markets are expecting the RBNZ to hold the Official Cash Rate (OCR) until May next year, but incoming data may determine the next decisions. Regarding employment, ANZ analysts expect to see a loosening in the sector and operating well beyond its “maximum sustainable level in the quarter”.
In terms of monetary policy, analysts believe that the data won’t suggest that the RBNZ’s job is done, but it will help to understand how the rates at 5.50% are affecting the labour markets.
That being said, the NZD traded with losses agains most of its rivals, including the AUD, JPY, USD, GBP, and EUR.
From a technical standpoint, the NZD/USD maintains a bearish outlook for the short term, as observed on the daily chart. The Relative Strength Index (RSI) is comfortably positioned in the negative territory below its midline. Its southward slope is complemented by a negative signal from the Moving Average Convergence Divergence (MACD), which shows red bars, signalling a growing bearish momentum. Additionally, the pair is below the 20,100 and 200-day Simple Moving Averages (SMAs), indicating a challenging position for the buyers in the bigger picture as the bears remain in command.
Support levels: 0.6140, 0.6120, 0.6100.
Resistance levels: 0.6180, 0.6197 (100-day SMA), 0.6222 (200-day SMA).
Technical Levels: Supports and Resistances
NZDUSD currently trading at 0.6146 at the time of writing. Pair opened at 0.6209 and is trading with a change of -1.01 % .
| Overview | Overview.1 | |
|---|---|---|
| 0 | Today last price | 0.6146 |
| 1 | Today Daily Change | -0.0063 |
| 2 | Today Daily Change % | -1.0100 |
| 3 | Today daily open | 0.6209 |
The pair remains strongly bearish on the daily time frame. It trades below the 20 SMA @ 0.6232, 50 SMA 0.6166, 100 SMA @ 0.6198 and 200 SMA @ 0.6222.
| Trends | Trends.1 | |
|---|---|---|
| 0 | Daily SMA20 | 0.6232 |
| 1 | Daily SMA50 | 0.6166 |
| 2 | Daily SMA100 | 0.6198 |
| 3 | Daily SMA200 | 0.6222 |
The previous day high was 0.6226 while the previous day low was 0.6149. The daily 38.2% Fib levels comes at 0.6197, expected to provide resistance. Similarly, the daily 61.8% fib level is at 0.6178, expected to provide resistance.
Note the levels of interest below:
- Pivot support is noted at 0.6163, 0.6118, 0.6086
- Pivot resistance is noted at 0.624, 0.6272, 0.6317
| Levels | Levels.1 |
|---|---|
| Previous Daily High | 0.6226 |
| Previous Daily Low | 0.6149 |
| Previous Weekly High | 0.6274 |
| Previous Weekly Low | 0.6120 |
| Previous Monthly High | 0.6413 |
| Previous Monthly Low | 0.6120 |
| Daily Fibonacci 38.2% | 0.6197 |
| Daily Fibonacci 61.8% | 0.6178 |
| Daily Pivot Point S1 | 0.6163 |
| Daily Pivot Point S2 | 0.6118 |
| Daily Pivot Point S3 | 0.6086 |
| Daily Pivot Point R1 | 0.6240 |
| Daily Pivot Point R2 | 0.6272 |
| Daily Pivot Point R3 | 0.6317 |
[/s2If]
Download Nehcap EAWe have two EAs that are operational on our LIVE accounts.
- EA-FIX: Check out the details here. Download EA-FIX . EA-FIX is a non-grid HFT scalper.
- EA-GROWTH: High quality low dd EA using trend grids. Download EA_GROWTHJoin Our Telegram Group
")


