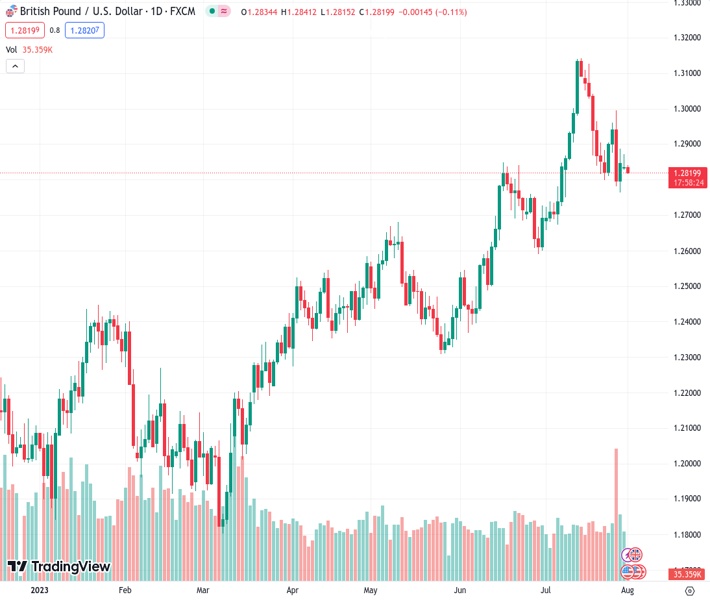
The GBPUSD currency pair, trading at 1.28193, declined slightly on Tuesday for the second consecutive day, although it did not show strong continuation in its downward movement.
…
This is a premium post.
[s2If !current_user_can(access_s2member_level4)]Please register for FREE REGISTER to read full post below containing analysis. In case of any error or you think you are not able to read the full post below, please email us at support#nehcap.com [lwa][/s2If] [s2If current_user_can(access_s2member_level1)]
- GBP/USD edges lower for the second straight day on Tuesday, albeit lacks follow-through.
The pair currently trades last at 1.28193.
The previous day high was 1.2873 while the previous day low was 1.2828. The daily 38.2% Fib levels comes at 1.2845, expected to provide resistance. Similarly, the daily 61.8% fib level is at 1.2856, expected to provide resistance.
The GBP/USD pair remains under some selling pressure for the second successive day on Tuesday, albeit manages to hold its neck above the 1.2800 mark through the Asian session.
The prospects for further policy tightening by the Federal Reserve (Fed) lift the US Dollar (USD) to its highest level since July 10, which, in turn, is seen as a key factor weighing on the GBP/USD pair. In fact, the US GDP report released last week pointed to an extremely resilient economy and kept the door open for one more 25 bps Fed rate hike in September or November. Furthermore, Fed Chair Jerome Powell had also said that the economy still needs to slow and the labour market to weaken for inflation to credibly return to the 2% target.
Apart from this, worries about a deeper economic downturn in China, fueled by the disappointing release of PMI prints for July, lend additional support to the safe-haven buck and contribute to a mildly offered tone surrounding the GBP/USD pair. That said, the latest optimism over hopes for more stimulus from China remains supportive of the underlying bullish sentiment around the equity markets. This, along with expectations that the Fed will end its fastest interest rate hiking cycle since the 1980s amid signs of cooling inflation, might cap the USD.
Apart from this, bets for more interest rate hikes by the Bank of England (BoE) could underpin the British Pound and help limit the downside for the GBP/USD pair, at least for the time being. In fact, the UK central bank is widely expected to raise its benchmark interest rate by 25 bps on August 3, to 5.25%, or the highest since early 2008. Moreover, the markets have been pricing in two more BoE rate hikes by the end of this year as price pressures persist. This, in turn, warrants caution before placing aggressive bearish bets and positioning for further losses.
Market participants now look to the final UK Manufacturing PMI for a fresh impetus. The US economic docket, meanwhile, features the release of the ISM Manufacturing PMI and JOLTS Job Openings data later during the early North American session. This, along with the broader risk sentiment, should allow traders to grab short-term opportunities. The market focus, however, will remain glued to the crucial BoE policy meeting on Thursday and the closely-watched US monthly employment details – popularly known as the NFP report on Friday.
Technical Levels: Supports and Resistances
GBPUSD currently trading at 1.2818 at the time of writing. Pair opened at 1.2835 and is trading with a change of -0.13 % .
| Overview | Overview.1 | |
|---|---|---|
| 0 | Today last price | 1.2818 |
| 1 | Today Daily Change | -0.0017 |
| 2 | Today Daily Change % | -0.1300 |
| 3 | Today daily open | 1.2835 |
The pair is trading below its 20 Daily moving average @ 1.2896, above its 50 Daily moving average @ 1.2706 , above its 100 Daily moving average @ 1.2561 and above its 200 Daily moving average @ 1.2294
| Trends | Trends.1 | |
|---|---|---|
| 0 | Daily SMA20 | 1.2896 |
| 1 | Daily SMA50 | 1.2706 |
| 2 | Daily SMA100 | 1.2561 |
| 3 | Daily SMA200 | 1.2294 |
The previous day high was 1.2873 while the previous day low was 1.2828. The daily 38.2% Fib levels comes at 1.2845, expected to provide resistance. Similarly, the daily 61.8% fib level is at 1.2856, expected to provide resistance.
Note the levels of interest below:
- Pivot support is noted at 1.2818, 1.2801, 1.2774
- Pivot resistance is noted at 1.2863, 1.289, 1.2907
| Levels | Levels.1 |
|---|---|
| Previous Daily High | 1.2873 |
| Previous Daily Low | 1.2828 |
| Previous Weekly High | 1.2996 |
| Previous Weekly Low | 1.2763 |
| Previous Monthly High | 1.3142 |
| Previous Monthly Low | 1.2659 |
| Daily Fibonacci 38.2% | 1.2845 |
| Daily Fibonacci 61.8% | 1.2856 |
| Daily Pivot Point S1 | 1.2818 |
| Daily Pivot Point S2 | 1.2801 |
| Daily Pivot Point S3 | 1.2774 |
| Daily Pivot Point R1 | 1.2863 |
| Daily Pivot Point R2 | 1.2890 |
| Daily Pivot Point R3 | 1.2907 |
[/s2If]
Download Nehcap EAWe have two EAs that are operational on our LIVE accounts.
- EA-FIX: Check out the details here. Download EA-FIX . EA-FIX is a non-grid HFT scalper.
- EA-GROWTH: High quality low dd EA using trend grids. Download EA_GROWTHJoin Our Telegram Group
")


