The Euro to US Dollar exchange rate has dropped further at the start of the week, reaching a new intraday low and getting closer to an important support level. However, analysts predict that the decline will be limited and not significant.
…
This is a premium post.
[s2If !current_user_can(access_s2member_level4)]Please register for FREE REGISTER to read full post below containing analysis. In case of any error or you think you are not able to read the full post below, please email us at support#nehcap.com [lwa][/s2If] [s2If current_user_can(access_s2member_level1)]
- EUR/USD extends week-start fall to refresh intraday low, approaching short-term key support line.
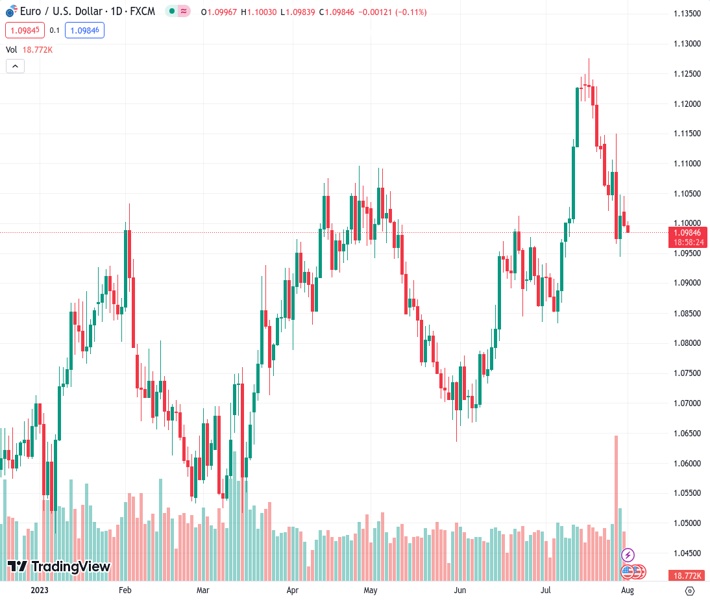
The pair currently trades last at 1.09860.
The previous day high was 1.1046 while the previous day low was 1.0994. The daily 38.2% Fib levels comes at 1.1014, expected to provide resistance. Similarly, the daily 61.8% fib level is at 1.1026, expected to provide resistance.
EUR/USD takes offers to refresh intraday high around 1.0980 amid very early Tuesday morning in Europe.
The Euro pair’s latest weakness could be linked to the failure to cross the 21-SMA. With this, the major currency pair drops for the second consecutive day while reversing Friday’s corrective bounce off a three-week low.
However, the sluggish MACD signals and below 50.0 levels of the RSI (14) suggests bottom-picking of the EUR/USD pair, which in turn highlights an upward-sloping support line from May 31, around 1.0960 by the press time, as the key challenge to the Euro bears.
Following that, the 50% Fibonacci retracement of the pair’s May-July upside, close to 1.0955, and the latest swing low of around 1.0945 may act as intermediate halts during the EUR/USD fall targeting the previous monthly low of around 1.0830.
On the flip side, a clear break of the 21-SMA level of 1.1025 needs validation from the double tops marked around 1.1050 to challenge a two-week-old descending resistance line surrounding 1.1105.
In a case where the EUR/USD pair remains firmer past 1.1105, the odds of witnessing a run-up toward the previous monthly high of around 1.1275 can’t be ruled out.
Fundamentally, the sour sentiment joins receding hawkish bias about the European Central Bank (ECB), backed by the recent Eurozone data, to weigh on the EUR/USD pair ahead of the key US ISM Manufacturing PMI for July and JOLTS Job Opening for June.
Also read: EUR/USD steadies near 1.1000 as firmer Eurozone inflation, GDP prods Euro bears, US ISM PMI eyed
Trend: Limited downside expected
Technical Levels: Supports and Resistances
EURUSD currently trading at 1.0987 at the time of writing. Pair opened at 1.0997 and is trading with a change of -0.09% % .
| Overview | Overview.1 | |
|---|---|---|
| 0 | Today last price | 1.0987 |
| 1 | Today Daily Change | -0.0010 |
| 2 | Today Daily Change % | -0.09% |
| 3 | Today daily open | 1.0997 |
The pair is trading below its 20 Daily moving average @ 1.1065, above its 50 Daily moving average @ 1.0918 , above its 100 Daily moving average @ 1.0907 and above its 200 Daily moving average @ 1.0725
| Trends | Trends.1 | |
|---|---|---|
| 0 | Daily SMA20 | 1.1065 |
| 1 | Daily SMA50 | 1.0918 |
| 2 | Daily SMA100 | 1.0907 |
| 3 | Daily SMA200 | 1.0725 |
The previous day high was 1.1046 while the previous day low was 1.0994. The daily 38.2% Fib levels comes at 1.1014, expected to provide resistance. Similarly, the daily 61.8% fib level is at 1.1026, expected to provide resistance.
Note the levels of interest below:
- Pivot support is noted at 1.0978, 1.096, 1.0926
- Pivot resistance is noted at 1.1031, 1.1065, 1.1083
| Levels | Levels.1 |
|---|---|
| Previous Daily High | 1.1046 |
| Previous Daily Low | 1.0994 |
| Previous Weekly High | 1.1150 |
| Previous Weekly Low | 1.0944 |
| Previous Monthly High | 1.1276 |
| Previous Monthly Low | 1.0834 |
| Daily Fibonacci 38.2% | 1.1014 |
| Daily Fibonacci 61.8% | 1.1026 |
| Daily Pivot Point S1 | 1.0978 |
| Daily Pivot Point S2 | 1.0960 |
| Daily Pivot Point S3 | 1.0926 |
| Daily Pivot Point R1 | 1.1031 |
| Daily Pivot Point R2 | 1.1065 |
| Daily Pivot Point R3 | 1.1083 |
[/s2If]
Download Nehcap EAWe have two EAs that are operational on our LIVE accounts.
- EA-FIX: Check out the details here. Download EA-FIX . EA-FIX is a non-grid HFT scalper.
- EA-GROWTH: High quality low dd EA using trend grids. Download EA_GROWTHJoin Our Telegram Group
")


