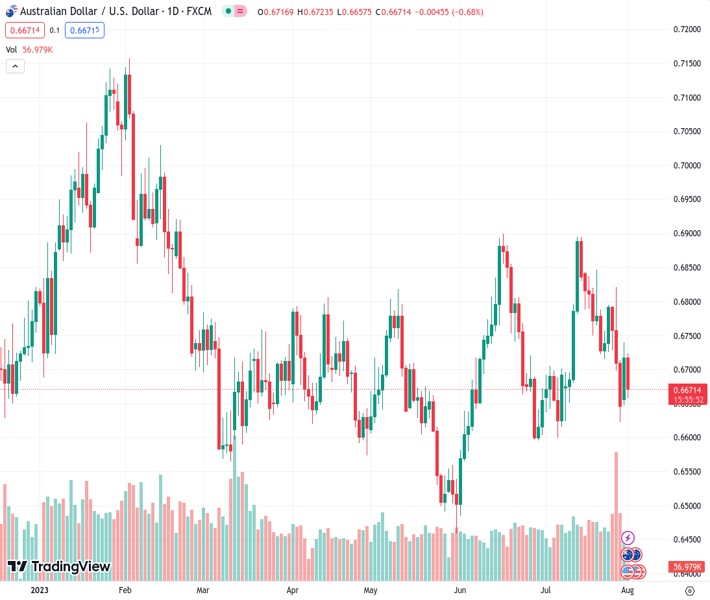
The AUDUSD currency pair is trading at 0.66710 and has fallen to its intraday low as the Reserve Bank of Australia (RBA) has chosen not to make any changes for the second meeting in a row.
…
This is a premium post.
[s2If !current_user_can(access_s2member_level4)]Please register for FREE REGISTER to read full post below containing analysis. In case of any error or you think you are not able to read the full post below, please email us at support#nehcap.com [lwa][/s2If] [s2If current_user_can(access_s2member_level1)]
- AUD/USD takes offer to refresh intraday low as RBA marks inaction for the second consecutive meeting.
The pair currently trades last at 0.66710.
The previous day high was 0.674 while the previous day low was 0.6648. The daily 38.2% Fib levels comes at 0.6705, expected to provide resistance. Similarly, the daily 61.8% fib level is at 0.6683, expected to provide resistance.
AUD/USD nosedives 40 pips on the Reserve Bank of Australia’s (RBA) no rate hike decision, extending the early-day losses to around 0.6670 heading into Tuesday’s European session. That said, the Aussie pair’s further downside, however, appears elusive as markets await the US ISM Manufacturing PMI for July and JOLTS Job Opening for June.
RBA defies market forecasts by keeping the benchmark rates intact at 4.1% after challenging the two hawkish surprises in the last monetary policy meeting in July. In doing so, the Aussie central bank renews dovish bias about the AUD/USD pair as it justifies the previously released downbeat Australian inflation data.
Also read: Breaking: RBA steers interest rate on a steady course at 4.10% in August
Apart from the RBA status quo, firmer US Dollar Index and downbeat China data, as well as mixed sentiment, also weigh on the AUD/USD price. That said, the US Dollar Index (DXY) renews a three-week high as Treasury bond yields rebound despite mixed US activity data published the previous day. The reason for the latest run-up in the DXY and yields could be linked to the hawkish comments from Federal Reserve Bank of Chicago President Austan Goolsbee. Also underpinning the US Dollar’s strength, as well as weighing on the Aussie pair, could be the fears of more US-China tussle as Beijing restricts drone exports in retaliation to the US tech and trade war tactics, by citing the “national security” measures.
Earlier in the day, China’s Caixin Manufacturing PMI for July fails to trace its upbeat NBS counterpart while declining to 49.2 for July from 50.5 prior, versus 50.3 market forecasts, marking the lowest level since January.
Against this backdrop, S&P500 Futures trace Wall Street and print mild gains by the press time whereas the US 10-year and two-year Treasury bond yields edge higher of late.
Having witnessed the initial market reaction to the RBA moves, the AUD/USD pair traders should keep their eyes on the risk catalysts for fresh impulse ahead of the US activity and employment data. Should the early signals for Friday’s US Nonfarm Payrolls (NFP) arrive positive, the Aussie pair sellers can keep the reins. It’s worth noting, however, that the bears need validation from Friday’s RBA Monetary Policy Statement (MPS) to stay in the driver’s seat afterward.
AUD/USD rebound appears elusive unless crossing a convergence of the previous support line from May 31 and the 200-DMA, around 0.6730-35 by the press time.
Technical Levels: Supports and Resistances
AUDUSD currently trading at 0.6703 at the time of writing. Pair opened at 0.6717 and is trading with a change of -0.21% % .
| Overview | Overview.1 | |
|---|---|---|
| 0 | Today last price | 0.6703 |
| 1 | Today Daily Change | -0.0014 |
| 2 | Today Daily Change % | -0.21% |
| 3 | Today daily open | 0.6717 |
The pair is trading below its 20 Daily moving average @ 0.6741, above its 50 Daily moving average @ 0.67 , above its 100 Daily moving average @ 0.6693 and below its 200 Daily moving average @ 0.6731
| Trends | Trends.1 | |
|---|---|---|
| 0 | Daily SMA20 | 0.6741 |
| 1 | Daily SMA50 | 0.6700 |
| 2 | Daily SMA100 | 0.6693 |
| 3 | Daily SMA200 | 0.6731 |
The previous day high was 0.674 while the previous day low was 0.6648. The daily 38.2% Fib levels comes at 0.6705, expected to provide resistance. Similarly, the daily 61.8% fib level is at 0.6683, expected to provide resistance.
Note the levels of interest below:
- Pivot support is noted at 0.6664, 0.661, 0.6572
- Pivot resistance is noted at 0.6755, 0.6793, 0.6847
| Levels | Levels.1 |
|---|---|
| Previous Daily High | 0.6740 |
| Previous Daily Low | 0.6648 |
| Previous Weekly High | 0.6821 |
| Previous Weekly Low | 0.6623 |
| Previous Monthly High | 0.6895 |
| Previous Monthly Low | 0.6599 |
| Daily Fibonacci 38.2% | 0.6705 |
| Daily Fibonacci 61.8% | 0.6683 |
| Daily Pivot Point S1 | 0.6664 |
| Daily Pivot Point S2 | 0.6610 |
| Daily Pivot Point S3 | 0.6572 |
| Daily Pivot Point R1 | 0.6755 |
| Daily Pivot Point R2 | 0.6793 |
| Daily Pivot Point R3 | 0.6847 |
[/s2If]
Download Nehcap EAWe have two EAs that are operational on our LIVE accounts.
- EA-FIX: Check out the details here. Download EA-FIX . EA-FIX is a non-grid HFT scalper.
- EA-GROWTH: High quality low dd EA using trend grids. Download EA_GROWTHJoin Our Telegram Group
")


