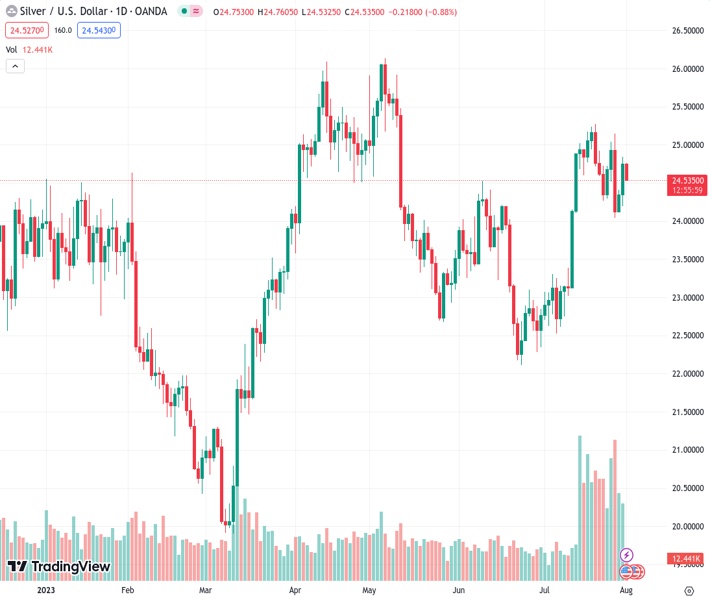
Silver encountered new resistance on Tuesday at a rate of 24.542. This hindered its attempt to rebound from the 100-day moving average, which had been ongoing for the past two days.
…
This is a premium post.
[s2If !current_user_can(access_s2member_level4)]Please register for FREE REGISTER to read full post below containing analysis. In case of any error or you think you are not able to read the full post below, please email us at support#nehcap.com [lwa][/s2If] [s2If current_user_can(access_s2member_level1)]
- Silver meets with a fresh supply on Tuesday and stalls a two-day-old recovery from the 100-DMA.
The pair currently trades last at 24.542.
The previous day high was 24.84 while the previous day low was 24.2. The daily 38.2% Fib levels comes at 24.59, expected to provide resistance. Similarly, the daily 61.8% fib level is at 24.44, expected to provide support.
Silver comes under some renewed selling pressure on Tuesday and extends its steady intraday descent through the early part of the European session. The white metal currently trades around the $23.55 area, down nearly 1% for the day, and for now, seems to have stalled a two-day-old recovery trend from the $24.00 mark, or a two-week low touched last Thursday.
The aforementioned handle coincides with a technically significant 100-day Simple Moving Average (SMA) and should continue to protect the immediate downside. A convincing break below will be seen as a fresh trigger for bearish traders and set the stage for deeper losses. The XAG/USD might then turn vulnerable and accelerate the downfall towards testing the next relevant support near the $23.20-$23.15 area.
This is closely followed by the very important 200-day SMA support near the $23.00 mark. Some follow-through selling will make the XAG/USD vulnerable to accelerate the fall towards challenging the multi-month low, around the $22.15-$22.10 area touched in June.
That said, technical indicators on the daily chart – though have been losing traction – as still holding in the positive territory. This, in turn, favours bullish traders and supports prospects for the emergence of some dip-buying at lower levels. However, it will still be prudent to wait for a sustained strength beyond the daily top, around the $24.75 region, before positioning for a move towards the $25.00 psychological mark.
The next relevant hurdle is pegged near the monthly peak, around the $25.25 zone, which if cleared will negate any negative outlook. Silver might then aim to surpass the $25.50-$25.55 intermediate hurdle and reclaim the $26.00 mark before climbing further to the YTD peak, around the $26.10-$26.15 area touched in May.
Technical Levels: Supports and Resistances
XAGUSD currently trading at 24.56 at the time of writing. Pair opened at 24.76 and is trading with a change of -0.81 % .
| Overview | Overview.1 | |
|---|---|---|
| 0 | Today last price | 24.56 |
| 1 | Today Daily Change | -0.20 |
| 2 | Today Daily Change % | -0.81 |
| 3 | Today daily open | 24.76 |
The pair remains strongly bullish on the daily timeframe. It trades above its 20 SMA @ 24.19, 50 SMA 23.67, 100 SMA @ 23.97 and 200 SMA @ 23.08.
| Trends | Trends.1 | |
|---|---|---|
| 0 | Daily SMA20 | 24.19 |
| 1 | Daily SMA50 | 23.67 |
| 2 | Daily SMA100 | 23.97 |
| 3 | Daily SMA200 | 23.08 |
The previous day high was 24.84 while the previous day low was 24.2. The daily 38.2% Fib levels comes at 24.59, expected to provide resistance. Similarly, the daily 61.8% fib level is at 24.44, expected to provide support.
Note the levels of interest below:
- Pivot support is noted at 24.35, 23.96, 23.71
- Pivot resistance is noted at 25.0, 25.24, 25.64
| Levels | Levels.1 |
|---|---|
| Previous Daily High | 24.84 |
| Previous Daily Low | 24.20 |
| Previous Weekly High | 25.15 |
| Previous Weekly Low | 24.04 |
| Previous Monthly High | 25.27 |
| Previous Monthly Low | 22.52 |
| Daily Fibonacci 38.2% | 24.59 |
| Daily Fibonacci 61.8% | 24.44 |
| Daily Pivot Point S1 | 24.35 |
| Daily Pivot Point S2 | 23.96 |
| Daily Pivot Point S3 | 23.71 |
| Daily Pivot Point R1 | 25.00 |
| Daily Pivot Point R2 | 25.24 |
| Daily Pivot Point R3 | 25.64 |
[/s2If]
Download Nehcap EAWe have two EAs that are operational on our LIVE accounts.
- EA-FIX: Check out the details here. Download EA-FIX . EA-FIX is a non-grid HFT scalper.
- EA-GROWTH: High quality low dd EA using trend grids. Download EA_GROWTHJoin Our Telegram Group
")


