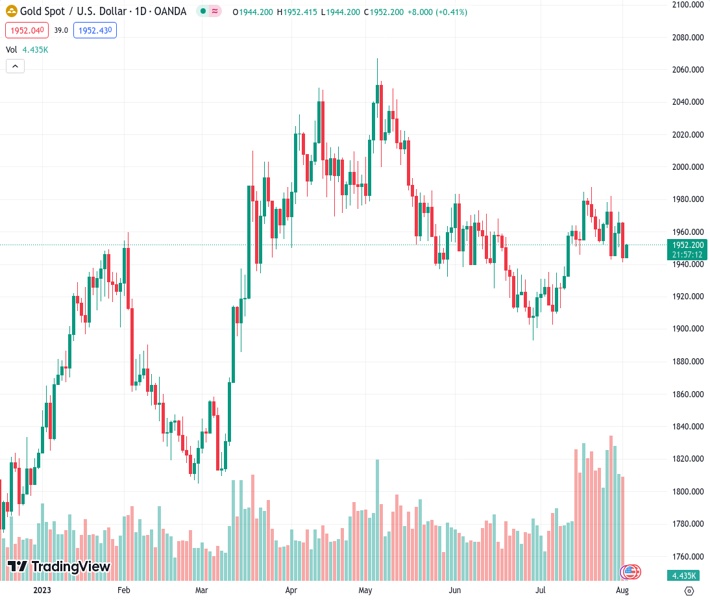
Gold price rebounds from its lowest point of the week following a daily decline, according to the current value of XAUUSD at 1,952.20. Analysts at Nehcap anticipate that the potential decrease will be minimal.
…
This is a premium post.
[s2If !current_user_can(access_s2member_level4)]Please register for FREE REGISTER to read full post below containing analysis. In case of any error or you think you are not able to read the full post below, please email us at support#nehcap.com [lwa][/s2If] [s2If current_user_can(access_s2member_level1)]
- Gold Price bounces off weekly low after reporting the first daily loss in three.
The pair currently trades last at 1952.20.
The previous day high was 1972.45 while the previous day low was 1950.67. The daily 38.2% Fib levels comes at 1964.13, expected to provide resistance. Similarly, the daily 61.8% fib level is at 1958.99, expected to provide resistance.
Gold Price (XAU/USD) begins Wednesday’s Asian session on a front foot, bouncing off the lowest levels in a week, as well as from the 200-SMA key support, as it justifies the United States government’s rate cut by the rating giant Fitch Ratings. In doing so, the yellow metal pares the previous day’s heavy losses with mild gains to around $1,950. However, the bears remain hopeful ahead of today’s United States Automatic Data Processing (ADP) Change Employment, the early signal for Friday’s Nonfarm Payrolls (NFP).
Gold Price recovers on the rate cut news but remains on the back foot as the United States data has mostly been positive and increased odds of the Federal Reserve’s (Fed) September rate hike.
On Tuesday, US ISM Manufacturing PMI for July improves to 46.4 from 46.0 prior, versus 46.8 expected. Further details unveil that ISM Manufacturing Employment Index slumped to 44.4 from 48.0 expected and 48.1 prior whereas the ISM Manufacturing Price Paid for the said month rose to 42.6 from 41.8, compared to 42.8 market forecasts. Elsewhere, the US JOLT Job Openings for June also eased to 9.582M compared to 9.62M expected and 9.616M previous readings (revised).
It should be noted that the CME’s FedWatch Tool hints at a gradual increase in the hawkish Fed bets for September.
With this, the US Dollar Index (DXY) rose to the highest level in three weeks and exerted downside pressure on the Gold Price, making it snap a two-day winning streak.
It’s worth noting that the latest retreat in the DXY, due to the news suggesting Fitch ratings’ downgrade to the US government by one notch, from AAA to AA+, puts a floor under the Gold Price. Also challenging the XAU/USD bears is the 200-SMA support and the consolidation in the quote ahead of today’s key United States data.
Downbeat headlines surrounding China and India, the two biggest gold consumers, also exert downside pressure on the XAU/USD price.
On Tuesday, the World Gold Council (WGC) marked a 2.0% yearly fall in the gold demand as higher interest rates by major central banks dent the physical demand of the XAU/USD.
More importantly, WGC India’s regional chief executive officer Somasundaram PR said, per Reuters, “India’s gold demand in 2023 could fall 10% from a year ago to their lowest in three years, as record high prices are dampening retail purchases.” That said, the WGC official expects a fall in New Delhi’s XAU/USD demand to 700 metric tons in 2023 from 774.1 metric tons a year ago.
On the other hand, downbeat China data and fears of the Sino-US tension flag challenges for the dragon nation’s economic recovery even if Beijing unveils multiple stimulus to defend the transition. That said, China’s Caixin Manufacturing PMI for July fails to trace its upbeat NBS counterpart while declining to 49.2 for July from 50.5 prior, versus 50.3 market forecasts, marking the lowest level since January. Further, China’s Commerce Ministry announced restrictions to drone exports in retaliation to the US tech and trade war tactics by citing the “national security” measures.
It’s worth observing that the recent improvements in the Indian and Chinese equities, however, restrict the downside of the Gold Price.
While the upbeat US Dollar and fears of receding demand from the top customers please the Gold sellers of late, the metal’s further downside hinges on the United States employment data. That said, the US Automatic Data Processing (ADP) Change Employment is known as the early signal for Friday’s key Nonfarm Payrolls (NFP) and can prod the US Dollar bulls, which in turn may trigger the Gold Price rebound, if matching or declining below the downbeat forecasts of 189K for July versus 497K prior.
Gold Price marks another bounce off the 200-SMA as sellers take a break near the $1,942 key SMA support level.
Highlighting the bearish bias is the formation of the lower high on the Relative Strength Index (RSI), placed at 14, and the XAU/USD price. Furthermore, the bearish signals on the Moving Average Convergence and Divergence (MACD) also lure the Gold sellers.
However, a clear downside break of $1,942 isn’t an open ticket for the Gold bears as a six-week-old horizontal support zone and an ascending trend line from June 28, close to the $1,935 zone, holds the key to the metal’s further downside toward the yearly low marked in June near $1,893.
Meanwhile, Gold Price recovery needs to cross the latest peak of around $1,973 to convince buyers. Even so, multiple resistances marked since February 19, near $1,985, can prod the XAU/USD upside before giving control to the bulls.
Overall, the Gold Price remains on the back foot but the bears need to conquer the $1,935 support to convince bears.
Trend: Limited downside expected
Technical Levels: Supports and Resistances
XAUUSD currently trading at 1949.85 at the time of writing. Pair opened at 1965.06 and is trading with a change of -0.77% % .
| Overview | Overview.1 | |
|---|---|---|
| 0 | Today last price | 1949.85 |
| 1 | Today Daily Change | -15.21 |
| 2 | Today Daily Change % | -0.77% |
| 3 | Today daily open | 1965.06 |
The pair is trading below its 20 Daily moving average @ 1950.56, above its 50 Daily moving average @ 1946.46 , below its 100 Daily moving average @ 1968.1 and above its 200 Daily moving average @ 1889.28
| Trends | Trends.1 | |
|---|---|---|
| 0 | Daily SMA20 | 1950.56 |
| 1 | Daily SMA50 | 1946.46 |
| 2 | Daily SMA100 | 1968.10 |
| 3 | Daily SMA200 | 1889.28 |
The previous day high was 1972.45 while the previous day low was 1950.67. The daily 38.2% Fib levels comes at 1964.13, expected to provide resistance. Similarly, the daily 61.8% fib level is at 1958.99, expected to provide resistance.
Note the levels of interest below:
- Pivot support is noted at 1953.0, 1940.95, 1931.22
- Pivot resistance is noted at 1974.78, 1984.51, 1996.56
| Levels | Levels.1 |
|---|---|
| Previous Daily High | 1972.45 |
| Previous Daily Low | 1950.67 |
| Previous Weekly High | 1982.20 |
| Previous Weekly Low | 1942.65 |
| Previous Monthly High | 1987.54 |
| Previous Monthly Low | 1902.77 |
| Daily Fibonacci 38.2% | 1964.13 |
| Daily Fibonacci 61.8% | 1958.99 |
| Daily Pivot Point S1 | 1953.00 |
| Daily Pivot Point S2 | 1940.95 |
| Daily Pivot Point S3 | 1931.22 |
| Daily Pivot Point R1 | 1974.78 |
| Daily Pivot Point R2 | 1984.51 |
| Daily Pivot Point R3 | 1996.56 |
[/s2If]
Download Nehcap EAWe have two EAs that are operational on our LIVE accounts.
- EA-FIX: Check out the details here. Download EA-FIX . EA-FIX is a non-grid HFT scalper.
- EA-GROWTH: High quality low dd EA using trend grids. Download EA_GROWTHJoin Our Telegram Group
")


