A slight increase in the value of the USD on Tuesday causes renewed interest in buying the USDCAD pair, supporting its upward movement.
…
This is a premium post.
[s2If !current_user_can(access_s2member_level4)]Please register for FREE REGISTER to read full post below containing analysis. In case of any error or you think you are not able to read the full post below, please email us at support#nehcap.com [lwa][/s2If] [s2If current_user_can(access_s2member_level1)]
- USD/CAD attracts fresh buying on Tuesday and draws support from a modest USD strength.
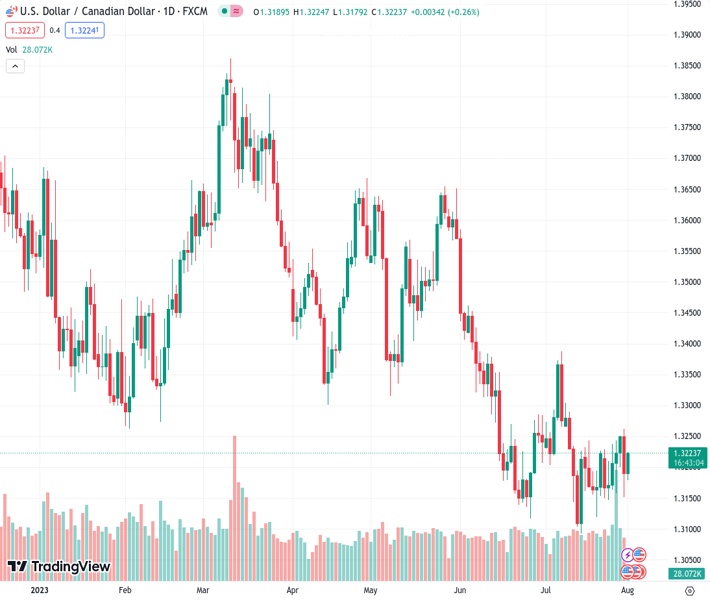
The pair currently trades last at 1.32235.
The previous day high was 1.3262 while the previous day low was 1.3151. The daily 38.2% Fib levels comes at 1.3193, expected to provide support. Similarly, the daily 61.8% fib level is at 1.3219, expected to provide support.
The USD/CAD pair regains some positive traction during the Asian session on Tuesday and reverses a major part of the previous day’s decline to the 1.3150 horizontal support. Spot prices currently trade around the 1.3220 region, up 0.25% for the day, and remain well within the striking distance of a three-week high touched on Monday.
The US Dollar (USD) scales higher for the second successive day and climbs to its highest level since July 10 amid the prospects for further policy tightening by the Federal Reserve (Fed), which, in turn, is seen acting as a tailwind for the USD/CAD pair. It is worth recalling that Fed Chair Jerome Powell had said last week that the economy still needs to slow and the labour market to weaken for inflation to credibly return to the 2% target. Adding to this, the upbeat US GDP report pointed to a resilient economy and left door for one more 25 bps Fed rate hike in September or November wide open. This remains supportive of elevated US Treasury bond yields, which, along with concerns that China’s post-COVID recovery is stalling, further benefits the Greenback’s relative safe-haven status.
That said, signs of receding underlying price pressures in the US could allow the Fed to soften its hawkish stance and end its fastest rate-hiking cycle since the 1980s. This, along with hopes for more stimulus from China, continues to boost investors’ confidence, which is evident from the underlying bullish sentiment across the global equity markets and cap gains for the USD. Apart from this, the recent strong runup in Crude Oil prices, to the hightest level since April 17, could underpin the commodity-linked Loonie and contribute to keeping a lid on any meaningful upside for the USD/CAD pair, at least for the time being. This makes it prudent to wait for strong follow-through buying before placing fresh bullish bets around the major and positioning for any further intraday appreciating move.
Market participants now look to the US economic docket, featuring the ISM Manufacturing PMI and JOLTS Job Openings. This, along with the broader risk sentiment, will drive the USD demand and provide some impetus to the USD/CAD pair. Traders will further take cues from Oil price dynamics to grab short-term opportunities. The focus, however, will remain glued to the closely-watched monthly employment details from the US (popularly known as the NFP report) and Canada on Friday. This should help determine the next leg of a directional move for the major.
Technical Levels: Supports and Resistances
USDCAD currently trading at 1.3221 at the time of writing. Pair opened at 1.319 and is trading with a change of 0.24 % .
| Overview | Overview.1 | |
|---|---|---|
| 0 | Today last price | 1.3221 |
| 1 | Today Daily Change | 0.0031 |
| 2 | Today Daily Change % | 0.2400 |
| 3 | Today daily open | 1.3190 |
The pair is trading above its 20 Daily moving average @ 1.3216, below its 50 Daily moving average @ 1.3299 , below its 100 Daily moving average @ 1.3418 and below its 200 Daily moving average @ 1.3461
| Trends | Trends.1 | |
|---|---|---|
| 0 | Daily SMA20 | 1.3216 |
| 1 | Daily SMA50 | 1.3299 |
| 2 | Daily SMA100 | 1.3418 |
| 3 | Daily SMA200 | 1.3461 |
The previous day high was 1.3262 while the previous day low was 1.3151. The daily 38.2% Fib levels comes at 1.3193, expected to provide support. Similarly, the daily 61.8% fib level is at 1.3219, expected to provide support.
Note the levels of interest below:
- Pivot support is noted at 1.314, 1.309, 1.303
- Pivot resistance is noted at 1.3251, 1.3311, 1.3361
| Levels | Levels.1 |
|---|---|
| Previous Daily High | 1.3262 |
| Previous Daily Low | 1.3151 |
| Previous Weekly High | 1.3255 |
| Previous Weekly Low | 1.3147 |
| Previous Monthly High | 1.3387 |
| Previous Monthly Low | 1.3093 |
| Daily Fibonacci 38.2% | 1.3193 |
| Daily Fibonacci 61.8% | 1.3219 |
| Daily Pivot Point S1 | 1.3140 |
| Daily Pivot Point S2 | 1.3090 |
| Daily Pivot Point S3 | 1.3030 |
| Daily Pivot Point R1 | 1.3251 |
| Daily Pivot Point R2 | 1.3311 |
| Daily Pivot Point R3 | 1.3361 |
[/s2If]
Download Nehcap EAWe have two EAs that are operational on our LIVE accounts.
- EA-FIX: Check out the details here. Download EA-FIX . EA-FIX is a non-grid HFT scalper.
- EA-GROWTH: High quality low dd EA using trend grids. Download EA_GROWTHJoin Our Telegram Group
")


